

Before I dedicated myself to I.T., I had studied computer engineering. It made sense at the time. I was the first person in my family in more generations than we can remember to go to college, and was good at programming, so of course that was the way to go. No, I had no clue what a computer engineer even did. And, objectively, I was a terrible engineering student — though whether that’s because of the undiagnosed ADHD or the fact that it wasn’t really what I wanted is an open question.
But I still managed to get to my first assembly class. I still own the textbook for it. As I learned it, and how it related to the machine code underneath, it felt good to be good at something naturally, and it had been a long moment since I felt that. Yes, I had been learning programming in one form or another since I was 12, so maybe it shouldn’t have been surprising, but it was nice.
Some of the exams and homework were rote programming: given a task, complete it in the language. But for multiple-choice questions, one popular task was this: given a snippet of code, how many operations will it take to run? Those start simple, count the instructions. But some instructions require multiple cycles to complete, and that’s before we take into account the branch situations that can lead to looping or skipping portions of code. With each new topic, this rather simple question became more complex, and it became more real to us that instruction count was rarely a good indication of execution count.
That was also clear in the LinkedIn Post I shared around one of my favorite casual games: Human Resource Machine, where you again are given a very similar instruction set and very similar tasks, with challenges for completing it within a given task count and execution count. Is it sad this counts as a casual game for me?
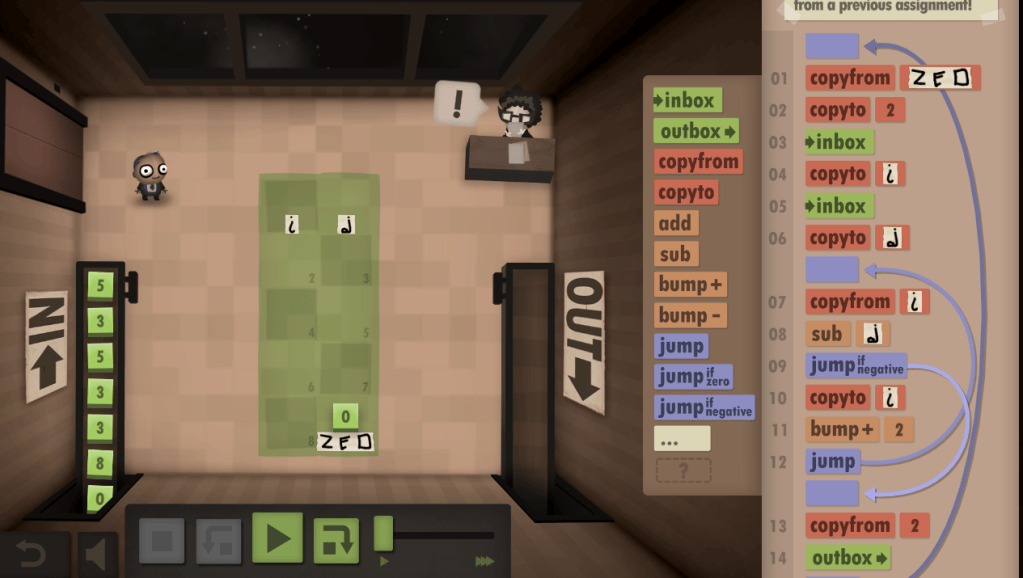
So it shouldn’t be any surprise that last week’s UBP announcement from Atlassian had me cracking my assembly textbook for the first time in 20+ years. As I said last week, it’s going to be important to you to audit your rules. I stand by that recommendation, so this week I want to do the math. By the end of this, you should be able to open any rule in your instance, read it, and come out with a monthly step count you would be willing to defend in a budget meeting.
A caveat before we get into it. This is all still new, Atlassian’s documentation is still being written, and what follows is my best current understanding rather than settled fact. Last week I got a claim wrong about how AI actions are metered, and Atlassian corrected me within a day. Take that as fair warning: I can be wrong about this, and on something moving this fast I probably will be again. Where better information turns up I will update this post and note what changed, so it may be worth coming back in a month to see what has moved. That being said, we are 85 days out as I write this, which is precious little time to audit your automation flows. I may be wrong on details, but I am not wrong about the shape of this, so it is worth reading through and getting started today.
The Meter Now Counts What Runs, Not What You Built
Jira Automation has always had some natural limits. Beyond the caps that were implemented in late 2023, you’ve always had hard rules for how many “instructions” you could fit in a given flow: 65 conditions, branches, and actions in a standard rule, 500 in an advanced rule. These limits are equivalent to your program in assembly, and directly determine your program size. And to be clear, nothing about these limits changes this December 3rd.
But much like Human Resource Machine, Atlassian is adding a second value we need to consider: “execution” steps. Atlassian’s documentation defines an automation step as a single executed part of the automation flow, and five component types count: triggers, conditions, actions, branches, and loops. Of those, I think the trigger is an understandable addition, but also the most insidious: we’ll talk about that in a moment. Each execution of each one is a step. In turn, a component that sits in a rule but never runs on a given execution costs you nothing on that execution.
Excluded are the system and synthetic components Atlassian runs on your behalf, and anything with a THROTTLED status. Agentic components are excluded as well, which is something I can say with more certainty than I could last week. After last week’s post went up, Atlassian reached out directly to confirm that AI actions in automation do not count toward automation steps. A Use Rovo or Use agent action draws down Rovo credits instead, and the rest of the rule around it, trigger and conditions and ordinary actions and branches, still counts as steps normally. There is no double charge on the AI action itself. Credit where it is due, they read a fairly critical post and came back with a helpful answer rather than a complaint. I have not found that written on any support page, so until they publish it, consider this paragraph the citation.
Then there is the part that changes the math more than the counting rules do. A step is charged when the execution ends in any of five statuses: SUCCESS, NO_ACTIONS_PERFORMED, SOME_ERRORS, ABORTED, and NO_MATCH.
And that last one, NO_MATCH, is the one I want to draw your attention to. Today, a rule that fires and gets filtered out in a condition costs you nothing, because the current model counts successful runs and a filtered run is not one. That changes in December. That run costs you its trigger and every condition it evaluated before it gave up. This is a dramatic change in how this runs: we are moving from a model that charges only for successful work to one that charges for any work attempted. And I think once you dig in, you are going to find a lot of flows designed such that you are wasting attempts you never needed to make.
So the number you want is not the size of the rule. It is the cost of the path the rule took, averaged over every time it ran. Open a rule, count the boxes on screen, multiply by last month’s runs, and you will produce a figure that, like an AI hallucination, is confidently incorrect. It can be either too high, when a condition near the top kicks most runs out early, or too low, when one branch component is doing forty items’ worth of work every time it fires.
One naming note before the arithmetic. Atlassian has moved its vocabulary from “rules” to “flows,” and this is in the product rather than only the documentation: the button on my own instance now reads Create Flow, and the usage screen is documented at System → Automation flows → Usage. I am going to keep saying “rule” through the worked examples, because that is still what most of us say out loud, and the counting model underneath is identical either way.
The Formula, and the Four Numbers It Needs
Here is the whole method. For a single rule:
Monthly steps = executions per month × average steps per execution
The second term takes the work, because a rule does not have one cost. It has a cost per path:
Average steps per execution = Σ (share of runs taking that path × steps on that path)
Steps on the path = 1 for the trigger + every condition evaluated + every action performed + 1 per branch or loop component + (items in the branch × components inside it)
That gives you four numbers to find:
- E, executions per month. Fixed by the schedule on a scheduled rule; from the audit log on an event-triggered one.
- P, the share of executions that make it past each condition. This is the hit rate, and it is usually the number nobody knows.
- N, the average number of items a branch or loop resolves to. Not the maximum. The average, over a typical month.
- C, the components on each path.
That is a dynamic instruction count with different units. E is the loop count, the path cost is the loop body, and P is the fraction of iterations that ever reach the expensive part. The three examples below are the same formula run three times, and each one goes wrong in a different place.
Worked Example One: Most of the Bill Is Runs That Did Nothing
Take an ordinary rule.
- Trigger: work item transitioned
- Condition: work type is Bug
- Condition: priority is Highest
- Action: notify a channel
- Action: set a field
- Action: add a comment
Six components on screen. Now count the paths.
A run where the work item is not a Bug costs the trigger and the first condition, and stops: 2 steps, ending in NO_MATCH. A Bug that is not Highest costs the trigger and both conditions: 3 steps. A run that passes everything costs 6 steps.
Say that space sees 5,000 transitions a month, a fifth of them on bugs, and a tenth of those bugs at Highest priority:
| Path | Runs | Steps each | Total |
|---|---|---|---|
Not a Bug (NO_MATCH) | 4,000 | 2 | 8,000 |
| Bug, not Highest | 900 | 3 | 2,700 |
| Full execution | 100 | 6 | 600 |
| 11,300 |
Two things fall out of that table. About 71% of what this rule costs is spent on runs that did nothing at all. And if you had counted the boxes and multiplied, you would have said 5,000 × 6 = 30,000 and budgeted for nearly three times the real figure.
That rule is a reasonable rule. Nobody built it badly. It happens to be attached to a trigger that fires far more often than the thing it cares about happens, and until December that has never had a price.
Worked Example Two: A Branch Charges You Per Item
Now the opposite error.
- Trigger: an epic transitioning to Done
- Branch: on the epic’s children
- Condition: check if the child is still open
- Action: transition the child to Done
- Action: add a comment
Five components on screen. Under today’s model that is one run, no matter how wide the epic is.
Under the step meter, with an epic averaging twelve children of which three are typically still open: trigger, 1. Branch component, 1. The condition inside the branch runs against every child, so 12. The two actions run only on the children that passed, so 3 × 2 = 6. Twenty steps for one execution. Two hundred epics a month closes out at 4,000 steps, where counting boxes would have given you 1,000.
Notice that the condition inside the branch is charged on all twelve children while the actions are charged on three. That asymmetry is the lever here. If the branch can be scoped by JQL so that it only ever returns open children, you pay 1 + 1 + (3 × 3) = 11 instead of 20, and the rule does exactly the same thing.
The wider problem with this shape of rule is that N belongs to your data rather than to you. A branch written against a space with a dozen children per epic behaves very differently against one that has grown to fifty, and nobody will have edited the rule in between.
Worked Example Three: Polling Is the Habit That Costs the Most
The third shape is a scheduled rule with a JQL trigger, and it is the one I would go looking for first.
- Trigger: Scheduled, every 15 minutes, with JQL, say
status = "In Progress" AND updated <= -5d - Branch: on the work items the JQL returned
- Action: Add a comment nudging the assignee
- Action: Add a “stale” label
- Action: Send a notification to the assignee
A rule on a fifteen-minute schedule runs 2,880 times in a thirty-day month. Give it a JQL trigger that finds something roughly 5% of the time, a branch, and three components applied to each item it finds. Call it 430 items handled across the month. The work costs 430 × 3 = 1,290 steps. The polling costs 2,880 triggers plus a branch on the 144 runs that found anything, which is 3,024 steps. Roughly 70% of that rule is looking around and finding nothing, and on an Enterprise plan at 1,000 steps per user per month it eats four users’ worth of allowance on its own.
Now change nothing except the schedule:
| Schedule | Executions | Polling steps | Work steps | Monthly total |
|---|---|---|---|---|
| Every 15 minutes | 2,880 | 3,024 | 1,290 | ~4,310 |
| Hourly | 720 | 830 | 1,290 | ~2,120 |
| Every 4 hours | 180 | 240 | 1,290 | ~1,530 |
The work term does not move, because the same items still get handled. Only the polling collapses, and going from a quarter-hour schedule to a four-hour one cuts the rule’s cost by about 65% while changing nothing about what it accomplishes, except how quickly. Make that trade deliberately: if the rule is doing SLA escalation, four hours is not an option and you keep paying for the fifteen minutes. If it is tidying up stale labels, nobody has ever noticed the difference between fifteen minutes and overnight.
Filter at the Trigger, Because a Run That Never Starts Is Free
So, here is the damage. A condition that filters out a run still costs you the trigger and the condition, so any rule that narrows with a condition costs you at least 2 steps every time it fires, even when it does nothing. But a trigger that never fires costs you nothing. Under the step meter, then, filtering at the trigger and filtering at the condition stop being equivalent, and every rule built as “trigger broadly, then narrow with a condition” is now going to start costing you. The rule in Example One spends 2 steps on every one of the 4,000 transitions it does not care about. Built instead on a transition trigger scoped to the specific transition, or a field value changed trigger scoped to the field in question, it does not execute at all on those events. The 8,000 steps do not get cheaper. They stop existing.
That is the first pass I would make on any rule sitting above your average: look at the trigger, look at the first condition, and ask whether the condition is doing work the trigger could have done instead. Often the answer is yes, and it was written that way because under a run meter it made no difference whatsoever. Honestly, even two weeks ago I was wondering why scope the trigger when I can just make it clear in the next step. Seems foolish now. The same logic applies to NO_ACTIONS_PERFORMED, where a rule that runs, evaluates cleanly and finds nothing to act on still charges for everything it evaluated on the way there.
Before you take that advice too far, go run created >= -30d order by created DESC on your own instance. That is your monthly floor for any rule on the work item created trigger, because that naked trigger fires once per work item whether or not anything downstream matches, and anything in a space you cannot browse is missing from the count.
Scope is the open question there. A rule scoped to one space should only run for that space, and today’s audit log behaves that way. I would expect that to hold under the meter, which would make your in-space creation rate the number that matters rather than the instance-wide one. I could not find anything in the documentation that confirms it, and of everything I could not settle, it is the answer I want most.
Either way, work item created is where this section’s advice runs out. Work item transitioned can be scoped to a single transition. Field value changed can be scoped to a field. Created takes nothing, and the builder makes that worse rather than better: it will offer you a condition right there on the trigger card, JQL or work item fields or user, which looks like filtering at the trigger and is not. Those are ordinary condition components drawn next to the trigger, and each one that evaluates is its own step, so filtering there costs two per creation rather than one.
The naked ones are worse still, because there is nothing to filter. On work item created, set a field, add a label, assign it. That rule is meant to run on everything, every execution is a run you wanted, and the bill is just the size of the workload. So what is left is smaller than what I have spent this section recommending. Scope tightly, so the rule watches the fewest spaces it can. Put the cheapest condition first, so the runs that exit do it in as few steps as possible. And merge rules that share a trigger, because three created rules in one space buy three triggers per work item where one rule holding all the actions buys one. I would rather say that than have you find it on your fourth rule.
What To Do With Twenty Minutes and the Audit Log
The awkward part is that you cannot measure this yet. I checked multiple instances I have access to while writing this, and the usage screen still reports runs remaining and highest-usage rules for all of them, which is the old unit. Step-level reporting per rule is not yet exposed anywhere I have found, and if it has appeared on yours I would like to hear about it, because it would change how I would spend the next ninety days.
So the practical method between now and December combines a measured number with a counted one:
- Pull E from the audit log. Executions per rule for a full calendar month is real data and it is already there.
- Read the rule and hand-count the path costs, including the cheap early-exit paths.
- Estimate P from the audit log too, comparing executions that ended in a result against those that were filtered.
- Estimate N by opening two or three of the work items the branch ran against and counting.
- Multiply, sum, and compare against seats × your per-plan allowance, remembering the allowance is pooled organization-wide now, so your “Just Jira” rules and your JSM rules draw on the same number.
Twenty minutes gets you through your five oldest rules, which is where I would start, because the rules nobody has edited in two years are the ones whose N has grown the most without anyone deciding it should. I put together a spreadsheet that does the arithmetic, so you are filling in E, P, N and the component counts rather than doing the sums by hand. Download the audit spreadsheet here.
One honest caveat. Every worked example above is my arithmetic against Atlassian’s published definitions rather than a number Atlassian has quoted, and there are two mechanics I could not settle from the documentation. I do not know whether the branch component itself is charged once per execution or once per item, and I have assumed once per execution throughout. I do not know whether a scheduled trigger returning an empty result charges only the trigger or the trigger plus whatever conditions sit above the branch, and I have assumed the trigger alone. Both assumptions are conservative, in the sense that the real numbers can only be higher. If you can settle either one against a real bill in December, tell me and I will correct this post.
Wrapping Up
Every rule on your instance has always had a static count and a dynamic count. The static one is what you see when you open it, it is what the service limits have always governed, and it has never cost you a thing. The dynamic one is what executes, and on December 3 it becomes the line item. Most of us have never had a reason to know that second number for a single rule, which is why the first one you work out is going to surprise you.
Three things to do with that, in the order I would do them. Run created >= -30d, because that is the cheapest way to find out whether you have a problem at all. Then open your rules, sort by last modified oldest first, and take the top five: write down how many times each ran last month, and count the steps on the path it takes when it does nothing. Then go looking for rules that share a trigger in the same space, because merging those is the only fix in this post that costs you nothing and holds no matter how the unsettled mechanics land in December.
That is an afternoon’s work, and December 3 is not moving. I would like to know what your created query came back with, and whether the most expensive rule turned out to be the one you would have guessed.
Until then, this is Rodney, asking: have you updated your Jira issues work items today?
Enjoyed this one? These posts are free and always will be — but if this saved you a headache or taught you something worth keeping, you can drop a tip in the Ko-fi jar. No paywall, no subscription, no catch. Just a thanks if the writing earned it.
→ Support The Jira Guy on Ko-fi
Discover more from The Jira Guy
Subscribe to get the latest posts sent to your email.


