Here’s a bit of a professional tip. Negative information is often better received if you pair it with possible solutions? So, for example, don’t come to management with just a problem. Instead, figure out a way to fix said problem, and pair it with that.
This situation was the case last week with a wonderful comment from long-time reader Normann Nielsen. He had some issues with last week’s article, as he was looking for a more holistic view of the User’s experience on Jira – especially when it comes to running automations. To be clear, I am not retracting last week’s article in any way. In it, I’m not trying to understand the entirety of how a User’s experience changes when adding a new App. Instead, I tried to get an instantaneous snapshot of how each specific App impacts your Jira instance. Such information could be invaluable during an App Evaluation period in determining if you want to move ahead with a P/O.
However, the great part of Normann’s comment was two suggestions on capturing the information he is more interested in.
I see two approaches that give more benefit:
Normann Nielsen
1) The typical “overall” experience like Google Analytics or Datadogs UX Monitoring/RUM – or similar. These will often pinpoint slow “Urls” over time – that we can investigate further and find some RCA.
2) APM stuff (JMX) like AppDynamics or DynaTrace. Very complicated – but has the ability to look into the engine of the JVM. Please do an article on using those
What is Datadog?
Datadog is a monitoring platform that helps you keep an eye on various metrics involved with your Jira instance. It’s similar to Grafana, which I have featured previously. However, as it’s entirely cloud-based, you don’t have to muck about with setting up all the back-end repositories and such. Being cloud-based has many pros and cons, which I won’t get into here, but honestly, the most significant factor is cost. If you have less than five hosts, you can use it for free. Any more, well, it will cost you.
However, I still love the platform as it’s a much easier way to get into monitoring. First, I’ll discuss setting up the various apparatus to measure your Jira instance, then give you a few examples of what those metrics look like.
Installing the Datadog Agent.
The first thing you will want to do after setting up your Datadog account is to install the agent onto your system. This will monitor your CPU and Memory usage, NTP Status, etc. It will also monitor JMX metrics as soon as we configure it. As I mentioned in my Archive Install guide, I’m currently using Ubuntu 20.04 as my distro of choice, so I’ll need to consider that as I install the agent.
In your datadog profile, go to Integrations -> Agents, then select the OS and Distro of your Jira Server.
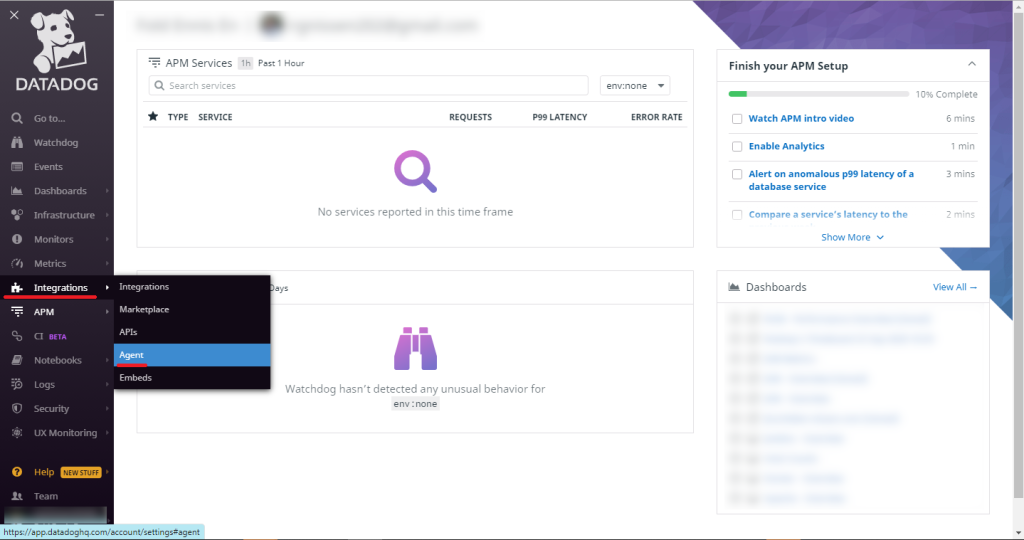
After you do this, it will give a one-line script to run on your instance. This script will also configure the agent to use your Datadog API Key. And installation is as easy as running that one line!
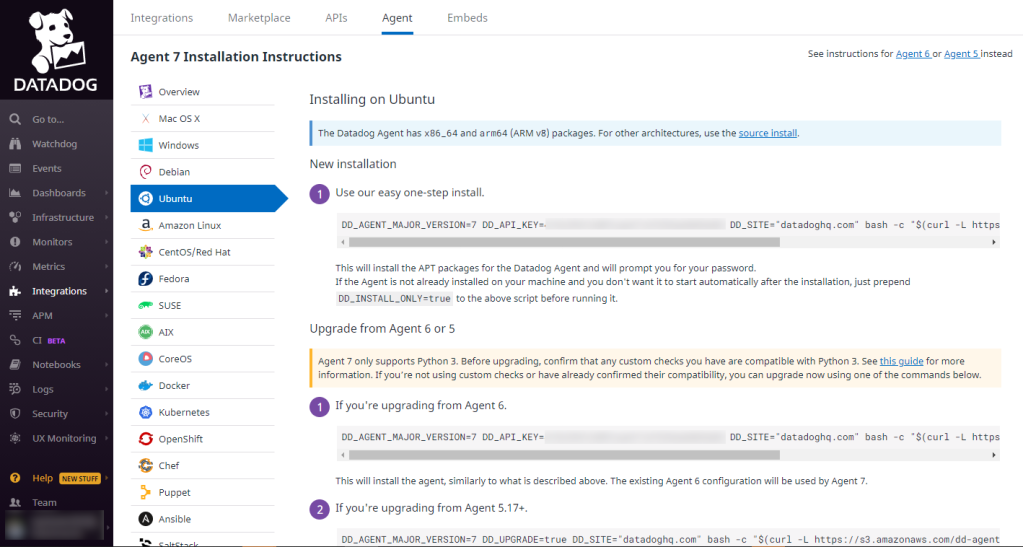
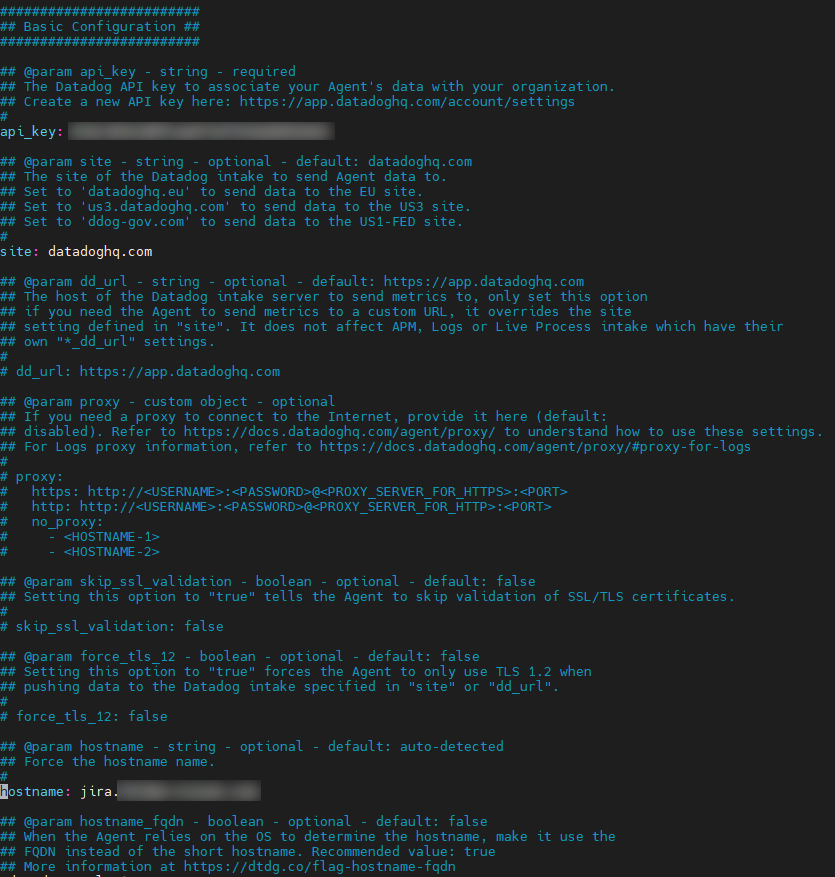
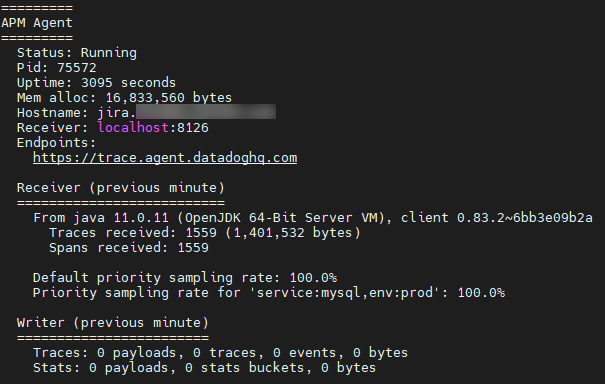
After it installs, run ‘datadog-agent status’ to confirm what the agent sees your hostname as. If it was like mine, where it only reported the first part of the FQDN, you can go to /etc/datadog-agent/datadog.yaml to confirm that your hostname is set up correctly.
JMX Monitoring
Now that we have the base agent installed let us work to set up JMX Monitoring.
Go to your Jira install directory, which by default should be at /opt/atlassian/jira. Once there, open the setenv.sh file in the bin directory
cd /opt/atlassian/jira
nano bin/setenv.sh
Once open, we are looking for the JVM_SUPPORT_RECOMMENDED_ARGS line. To this, we’ll add:
-Dcom.sun.management.jmxremote=true -Dcom.sun.management.jmxremote.port=<<Port of your choice>> -Dcom.sun.management.jmxremote.rmi.port=<<Same port as above>> -Dcom.sun.management.jmxremote.local.only=false -Dcom.sun.management.jmxremote.ssl=false -Djava.rmi.server.hostname=<<Your Jira URL>>
Next, we’ll go to wherever your JAVA_HOME is. If you have installed OpenJDK 11, it will be at /usr/lib/jvm/java-11-openjdk-amd64. Once there, we will open a new file at conf/management/jmxremote.password.
cd /usr/lib/jvm/java-11-openjdk-amd64
nano conf/management/jmxremote.password
Once we have this file open, we’ll add the following line, replacing Password with one you choose.
monitorRole Password
Save that file, then make sure that the permissions on this file are set up correctly.
chmod 600 /usr/lib/jvm/java-11-openjdk-amd64/conf/management/jmxremote.password
chown jira:jira /usr/lib/jvm/java-11-openjdk-amd64/conf/management/jmxremote.password
Now you can restart Jira. While Jira restarts, we can set up Datadog to monitor the new JMX Port. Go to directory /etc/datadog-agent/conf.d/jmx.d, then open a new file conf.yaml.
cd /etc/datadog-agent/conf.d/jmx.d
nano conf.yaml
Once there, enter the information below:
init_config:
instances:
  - host: localhost
    port: 8099
    user:  monitorRole
    password: <<Password from jmxremote.password>>
    conf:
      - include:
        domain: com.atlassian.jira
        bean:
           - com.atlassian.jira;type=entity.customfields.total
           - com.atlassian.jira;type=entity.issues.total
           - com.atlassian.jira;type=entity.users.total
           - com.atlassian.jira;type=entity.groups.total
           - com.atlassian.jira;type=jira.license
        attribute:
           Value:
             metric_type: gauge
             alias: jmx.value
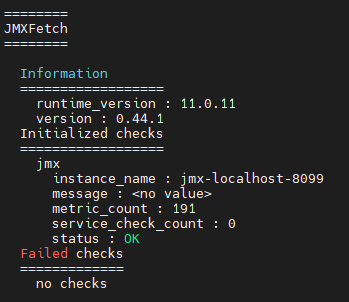
Save this file, then restart the datadog agent using the command below. On the status, make sure that the JMX section is reporting OK.
systemctl restart datadog-agent;sleep 5;datadog-agent status
APM
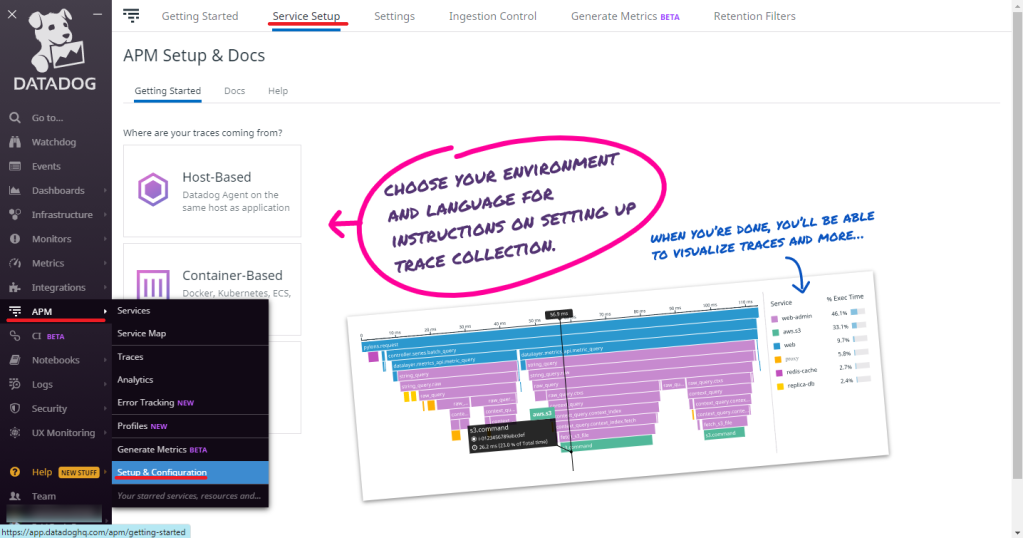
The next area we are going to setup will be our last on the command line, but it will give us some detailed analysis of how our system is performing. We will be setting up APM, or Application Performance Monitoring. TO start with this, go to APM->Setup & Configuration on the Datadog Site, and go to the Service Setup Tab.
Now click on “Host-Based,” and choose “Java” as your language on Step 2.
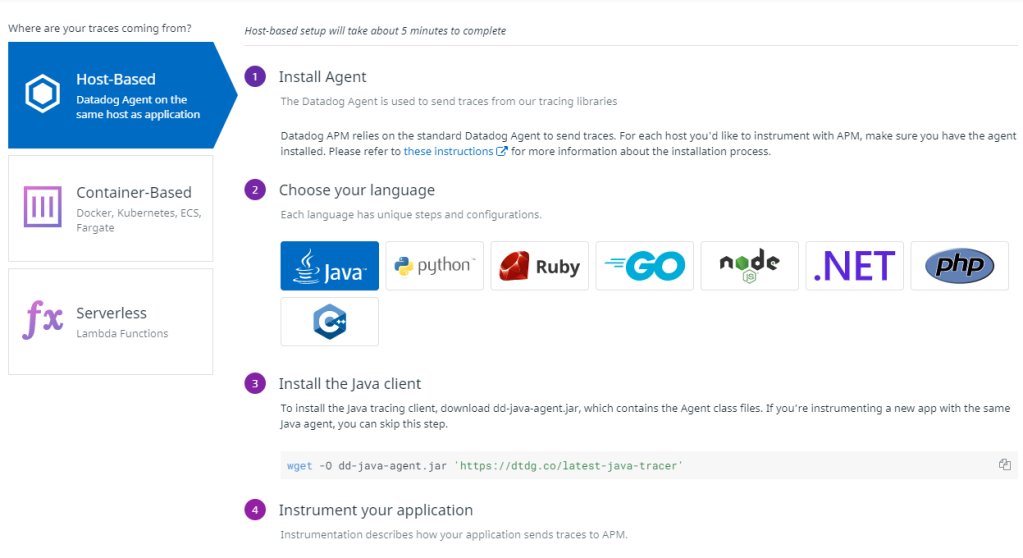
Now on your command line, go back to your Jira install directory (/opt/atlassian/jira by default), and copy the wget command from Step 3 to your terminal and execute it. This will download the necessary JAR file.
Once the jar file is downloaded, be sure to change it’s permissions to match the rest of your install directory
chown jira:jira dd-java-agent.jar
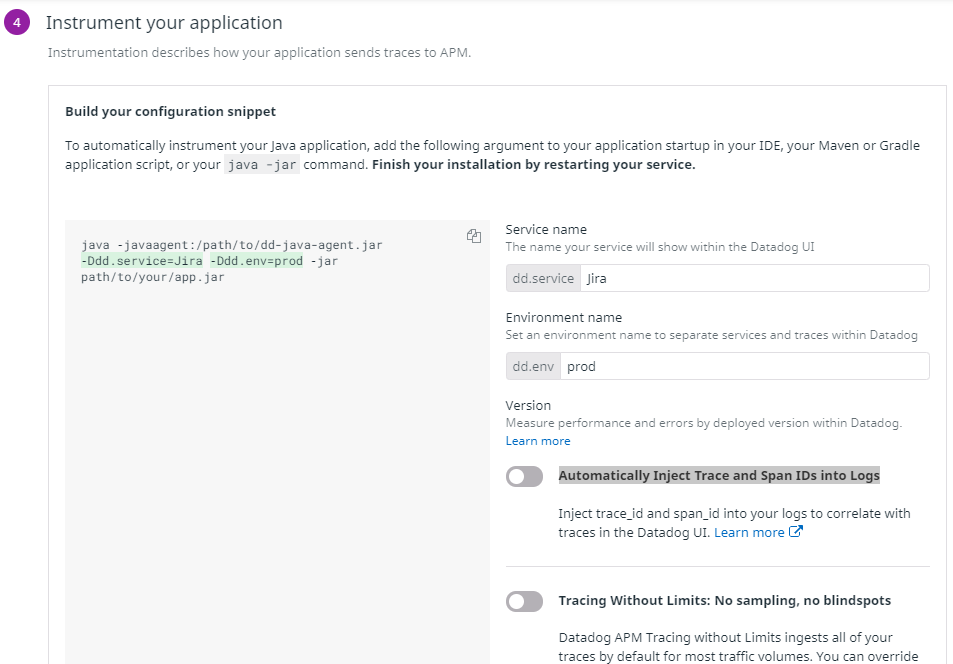
Now go to step 4, and enter “Jira” as your dd.service, and the appropriate environment under dd.env. Deselect “Automatically Inject Trace and Span IDs into Logs”
Now open up your bin/setenv.sh file again, and once again add the following to the JVM_SUPPORT_RECOMMENDED_ARGS.
-javaagent:/opt/atlassian/jira/dd-java-agent.jar -Ddd.service=Jira -Ddd.env=prod
Save the file, and once again, restart your Jira instance. Once it’s back up, run the datadog agent restart and status again to confirm it’s picking up APM information from Jira.
Realtime User Monitoring
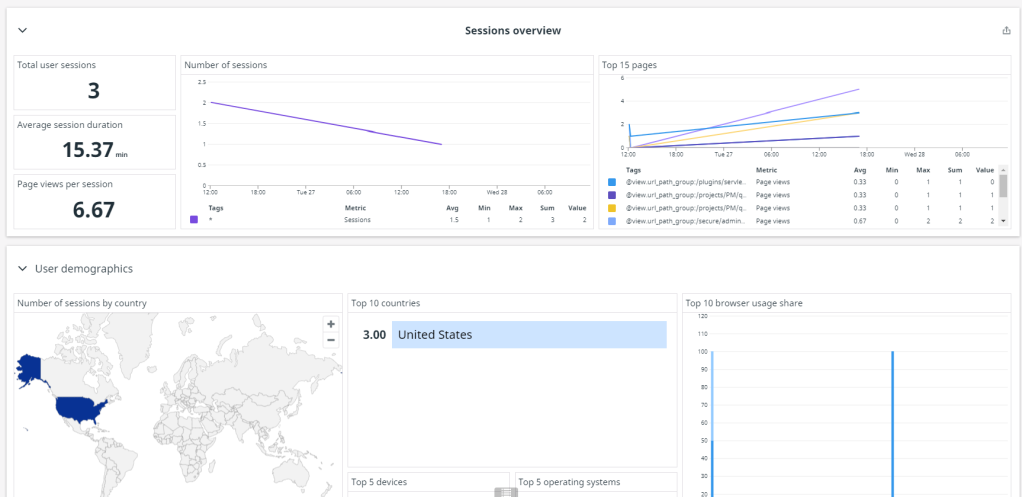
We have one last thing to set up with Datadog, and that is the main event, Realtime User Monitoring. This functionality is similar to Google Analytics, without the usual privacy headaches that anything Google brings.
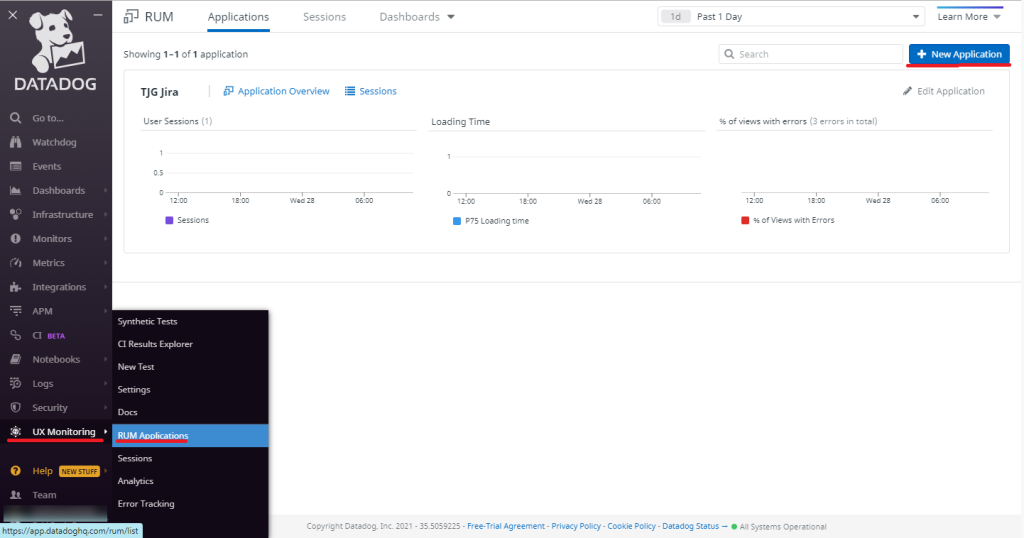
To access this, go to UX Monitoring -> RUM Applications on your Datadog site, then click “New Application to get started.
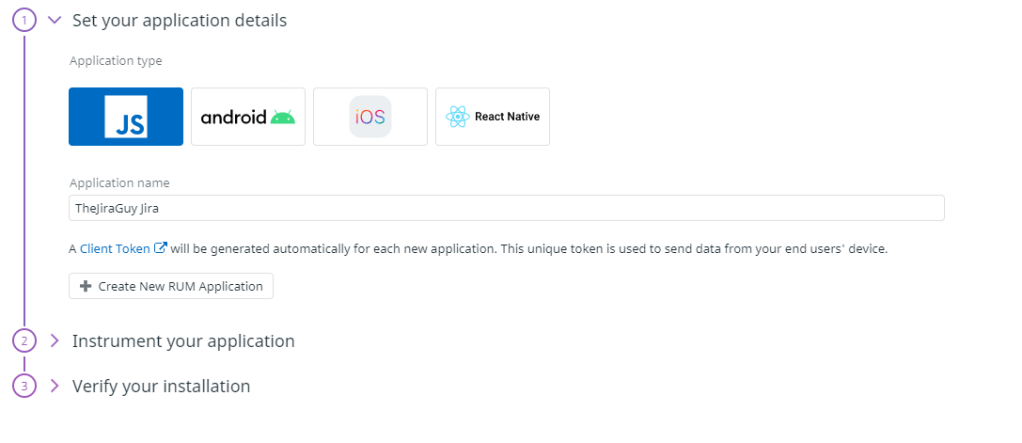
Select “JS” for your Application Type (JS standing for JavaScript), then enter a Name. For example, I went with “TheJiraGuy Jira” here. Then click “Create New RUM Application.”
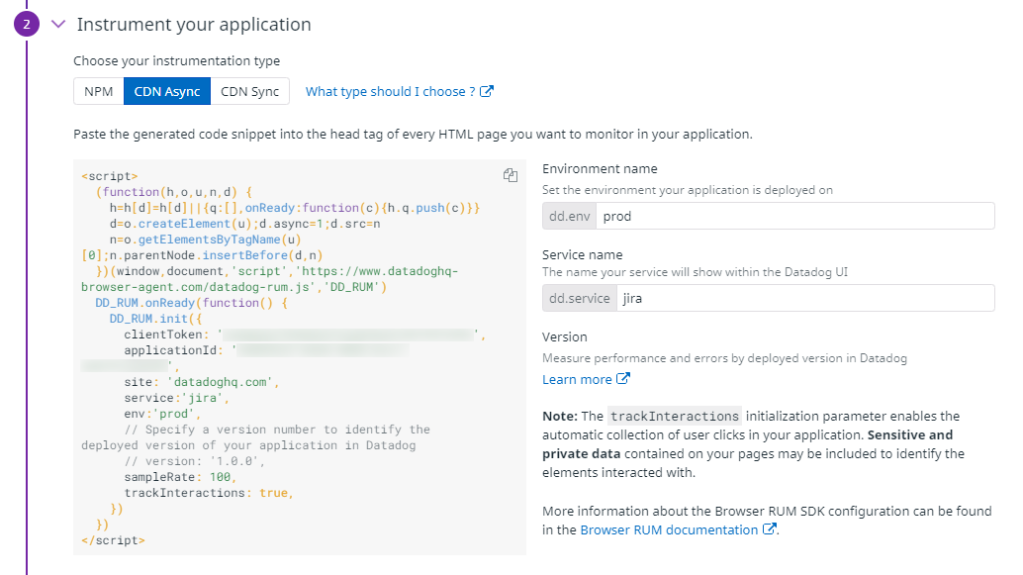
This will open up Section 2: “Instrument your Application”. Under here, select “CDN Async” as your option. Then, as with before, enter “Jira” for dd.service, and your environment for dd.env. You should see something like this.
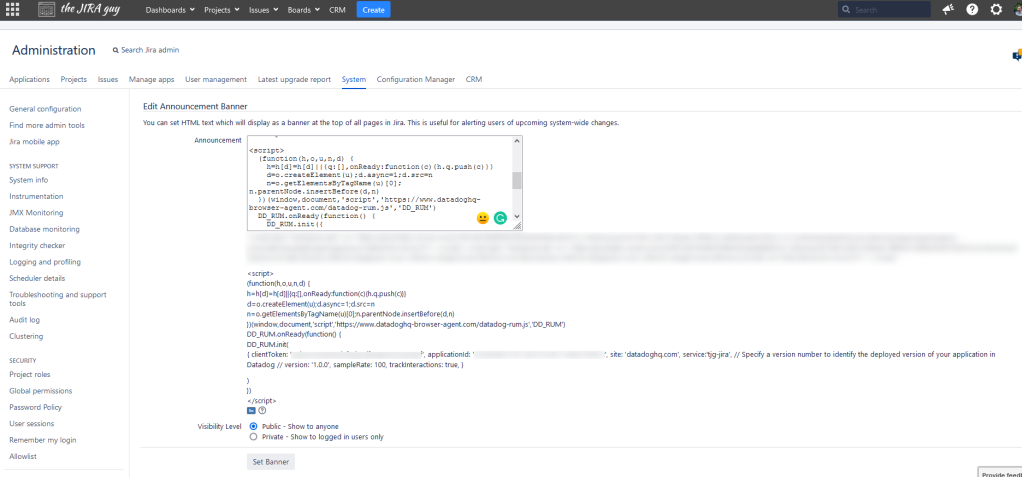
Copy the javascript, and on your Jira instance, go to System -> Announcement Banner, and paste this into your Announcement banner. After that, click “Set Banner.” and navigate back to your Jira Dashboard of choice.
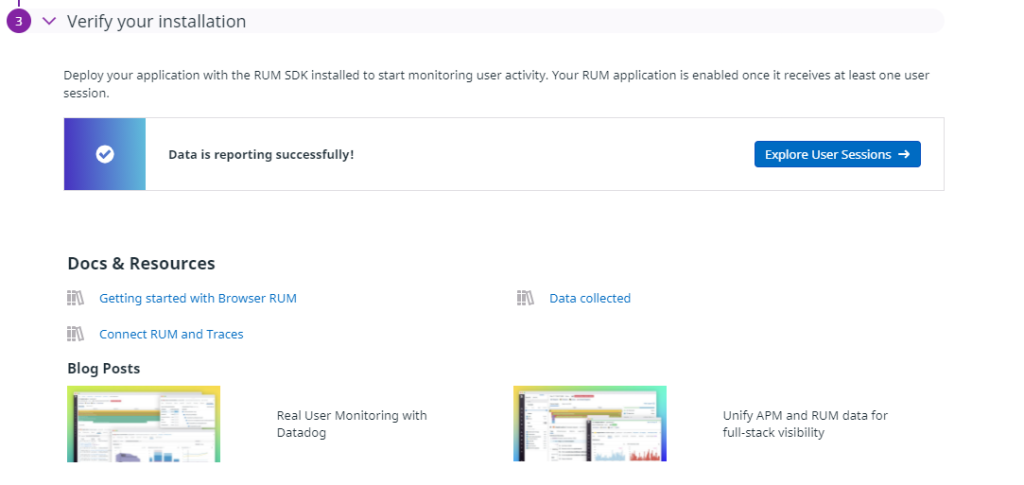
If you go back to your Datadog site, you should see this happy little greeting under Step 3. This will let you know everything is running correctly!
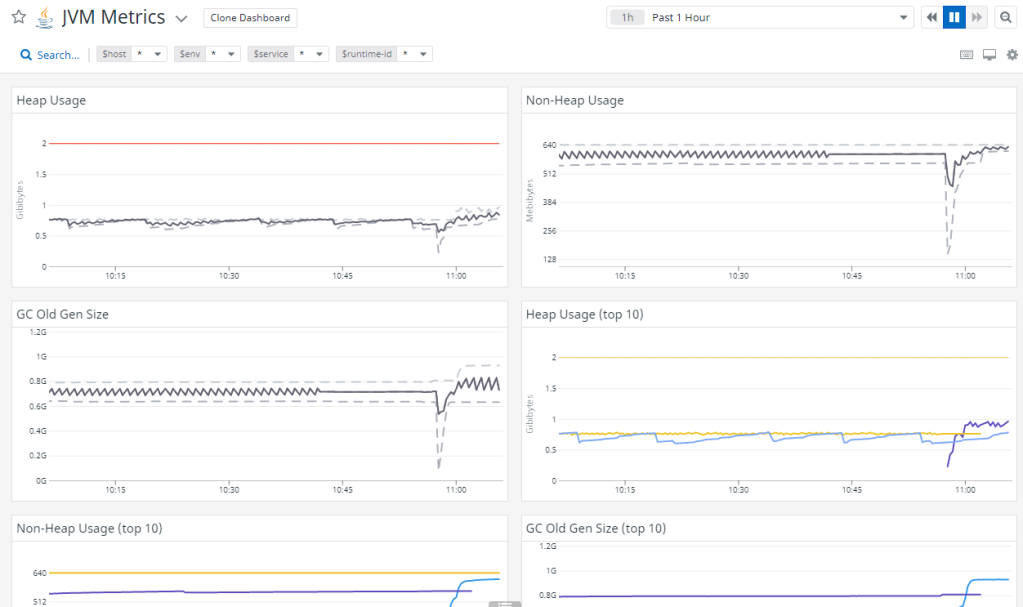
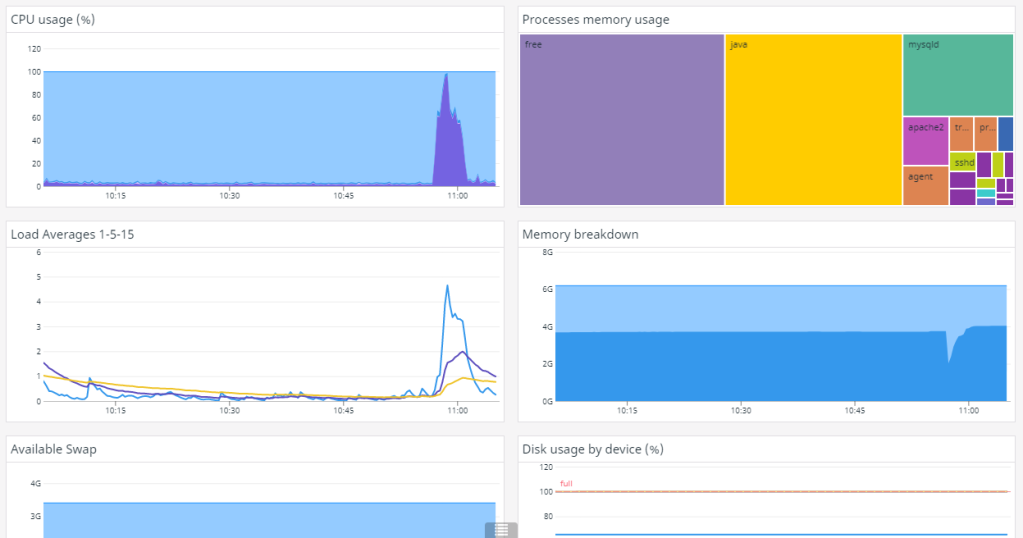
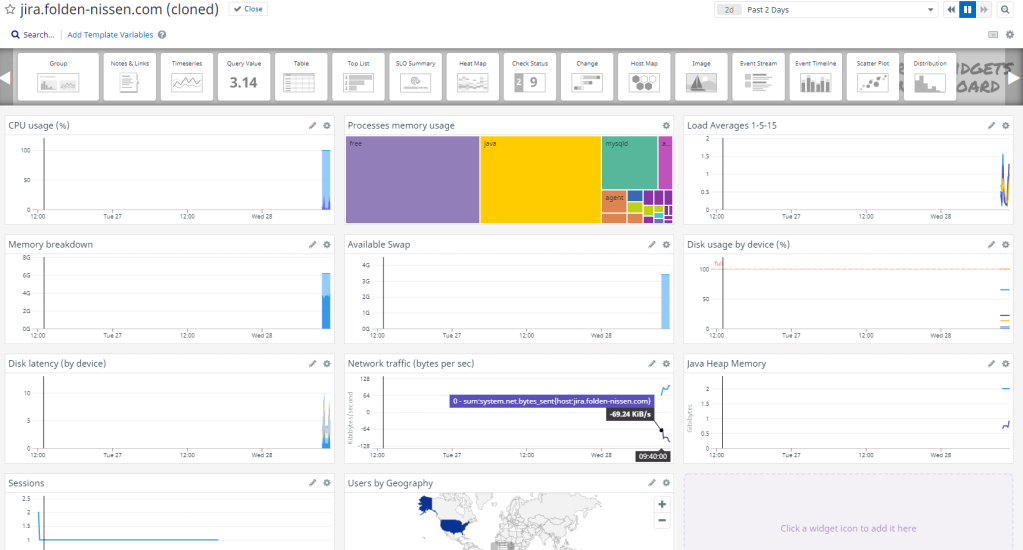
What what did all this get you?
Well, Dashboards! Datadog has a bunch of built-in dashboards. For example, here are two for System stats and JMX.
These on their own are powerful enough, but then with RUM, you can also monitor user load and see what pages users are having problems with.
Combine that with the fact that you can create custom Dashboards that show the Metrics you care about in one place, all time-coordinated, which means you can have powerful tooling to correlate user traffic to system performance.
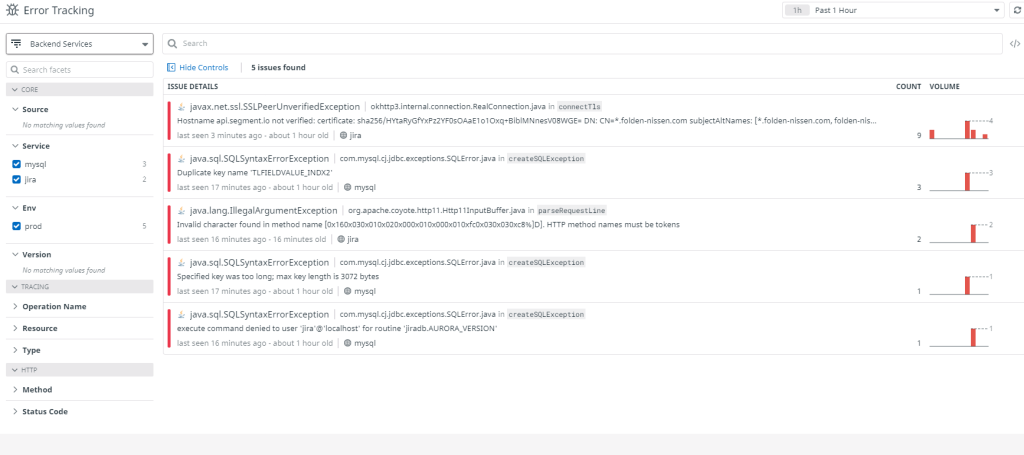
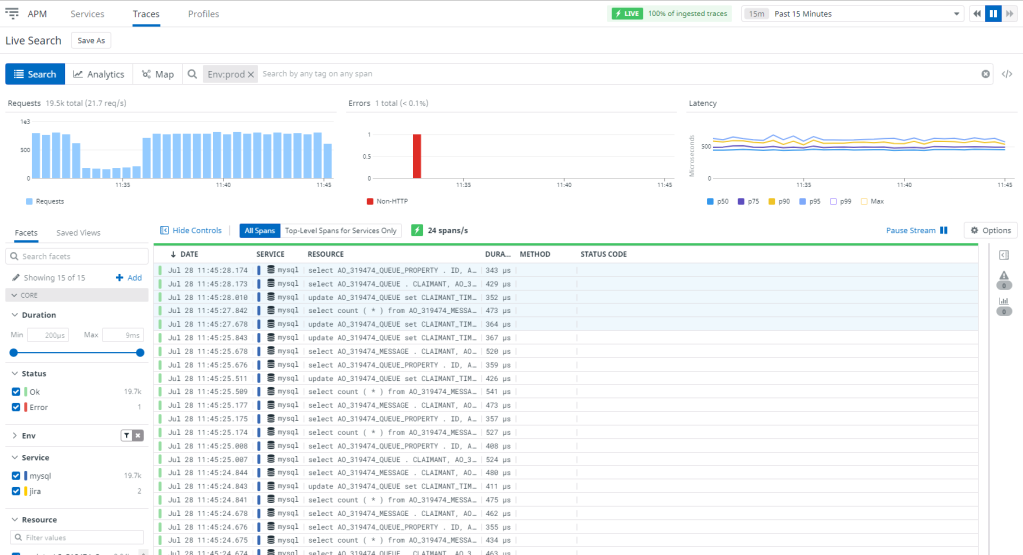
And as the coup-d’etat, you can also monitor your Application for Errors and performance issues in near-real-time via the APM monitoring.
So, what do you think?
Are you monitoring your system? What’s your tool of choice? I love datadog myself, though I’m always looking for better options. Let me know what you’re doing by leaving a comment! You can find me on Twitter, Facebook, LinkedIn, and Instagram. You can also subscribe to the blog below to get the latest posts emailed to you as soon as they are published. But until next time, my name is Rodney, asking, “Have you updated your Jira Issues today?”
Discover more from The Jira Guy
Subscribe to get the latest posts sent to your email.

Damn awesome, thanks !
LikeLiked by 1 person