Today is special. Today, not only do I get to flex my sysadmin muscles, but today’s article is also about monitoring Confluence. Yes, that other Atlassian Product I tend to ignore.
Now, don’t get me wrong, I don’t have anything against Confluence. On the contrary, I love it. It’s just that whenever I have to manage both, Jira somehow finds ways to take up more of my time. It’s far more configurable, which means people seem to want more out of it.
But, I managed to get this letter this week. You see, about six months ago, I wrote a guide about monitoring Jira on Datadog, which did include JMX Monitoring. However, I’ll let them explain their problems when they tried to adapt the instructions to Confluence.
Hello,
I followed your doc on setting up Jira with Datadog, and all seems okay. I then tried to do the same for Confluence, and it all looked great until I tried to go to User Directories. For some oddball reason, it brings up a page saying page not found.
It seems very specific to the jar:
-javaagent=”-javaagent:/var/atlassian/application-data/shared-home/dd-java-agent.jar -Ddd.service=confluence -Ddd.env=dev0″
My guess is the bean definitions are wrong:
bean:
– com.atlassian.confluence;type=entity.issues.total
– com.atlassian.confluence;type=entity.users.total
– com.atlassian.confluence;type=entity.groups.total
– com.atlassian.confluence;type=confluence.licenseI kind of guessed those were the ones (i.e., I replaced com.atlassian.jira with com.atlassian.confluence in those.
A TJG Reader
Have you had experience setting up Datadog with Confluence? My apology; I realize you are thejiraguy and not theconfluenceguy.
Well, reader, while I am not The Confluence guy, I am a confluence guy. So this week, we will set up JMX monitoring in Confluence and configure Datadog to use the correct MBeans!
Getting Confluence to use JMX
Now, I should mention here that the setup between Jira and Confluence is somewhat similar, with the only differences being fine details here and there. Despite being very different products, they share similar mechanics under the hood. I’ve always felt like they started with the same codebase at one point and have just been slowly drifting apart since.
So, like with Jira, we need to tell Confluence to use JMX. Go to your Confluence install directory, and once there, open the bin/setenv.sh file.
cd /opt/atlassian/jira
nano bin/setenv.sh
Once there, we will look for the CATALINA_OPTS section, adding the lines for the JMX Monitoring. I like to define sections for the Atlassian-Defined and User-Defined CATALINA_OPTS, just for my future self’s sake.
#Critial User Defined Catalina Options
CATALINA_OPTS="-Dcom.sun.management.jmxremote=true ${CATALINA_OPTS}"
CATALINA_OPTS="-Dcom.sun.management.jmxremote.port=<<Port of your choice>> ${CATALINA_OPTS}"
CATALINA_OPTS="-Dcom.sun.management.jmxremote.ssl=false ${CATALINA_OPTS}"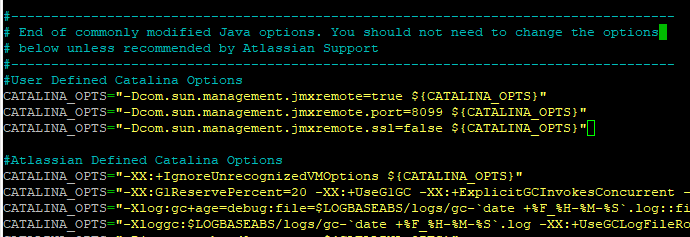
Now that we have that setup, we need to go to the $JAVA_HOME directory and modify a few files there. Save the setenv.sh file, then go to your JAVA_HOME. For Ubuntu running OpenJDK 11, that will be /usr/lib/jvm/java-11-openjdk-amd64. Once there, open the conf/jmxremote.password file. This action should open an empty file.
cd /usr/lib/jvm/java-11-openjdk-amd64
nano conf/management/jmxremote.password
Once this file is open, we’ll add the following line, replacing the password with the one you choose.
monitorRole PasswordAfter entering that, please save the file, and perform the following commands to secure it.
chmod 600 /usr/lib/jvm/java-11-openjdk-amd64/conf/management/jmxremote.password
chown confluence:confluence /usr/lib/jvm/java-11-openjdk-amd64/conf/management/jmxremote.password
You can now restart Confluence. I typically monitor the log file <<install_dir>>/logs/catalina.out the first time, as any errors will show up there. Assuming you did everything correctly, though, Confluence should start up smoothly.
You can follow the Jira Guide to install the Datadog agent – that process is no different in Confluence. Once the agent is installed, though, we will still need to configure it to connect and read the JMX Data from Confluence.
To do this, we go to the datadog JMX configuration directory and open up the configuration file.
cd /etc/datadog-agent/conf.d/jmx.d
nano conf.yaml
This command should also open up a new, blank file. Copy the following text in.
init_config:
instances:
  - host: localhost
    port: 8099
    user: monitorRole
    password: "<<Password from jmxremote.password>>"
    conf:
      - include:
        bean: Confluence:name=IndexingStatistics
        attribute:
          - Flushing
          - LastElapsedMilliseconds
          - TaskQueueLength
          - ReIndexing
      - include:
        bean: Confluence:name=MailTaskQueue
        attribute:
          - ErrorQueueSize
          - Flushing
          - FlushStarted
          - RetryCount
          - TaskSize
      - include:
        bean: Confluence:name=RequestMetrics
        attribute:
          - AverageExecutionTimeForLastTenRequests
          - CurrentNumberOfRequestsBeingServed
          - ErrorCount
          - NumberOfRequestsInLastTenSeconds
          - RequestsBegan
          - RequestsServed
      - include:
        bean: Confluence:name=SystemInformation
        attribute:
          - ConfluenceUpTime
          - ConfluenceVersion
      - include:
        bean: com.atlassian.instrumentation.confluence:type=Counter,name=Confluence.Usage.LocalUsers
        attribute:
          - Name
          - Value
      - include:
        bean: com.atlassian.instrumentation.confluence:type=Counter,name=Confluence.Usage.TotalSpace
        attribute:
          - Name
          - Value
      - include:
        bean: com.atlassian.instrumentation.confluence:type=Counter,name=Confluence.Usage.PersonalSpaces
        attribute:
          - Name
          - Value
      - include:
        bean: com.atlassian.instrumentation.confluence:type=Counter,name=Confluence.Usage.GlobalSpaces
        attribute:
          - Name
          - Value
      - include:
        bean: com.atlassian.instrumentation.confluence:type=Counter,name=Confluence.Usage.CurrentContent
        attribute:
          - Name
          - Value
Please note that I had to put my password in quotes, and you likely will too. After this, change the owner of the file to dd-agent with the following:
chown dd-agent:dd-agent conf.yamlRestart Datadog, and check its status to ensure it’s picking up everything. The JMX Section should look like this (Note the Number of Metrics picked up).
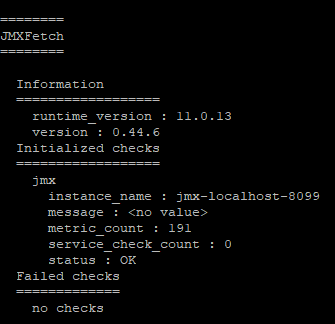
And that should be it for setting up JMX Monitoring. The real trick here was setting up the correct MBeans – which I wish was better documented. In the end, I had to connect my local jconsole to my Confluence test rig to see what MBeans were actually exposed.
I should note that this isn’t as developed as the Jira Metrics are. I can get a LocalUsers count, but I have no idea if that includes remote users from AD, for example. I also have no way to get the current license count, so using this for License monitoring is difficult, at best. Likewise, I can see how many requests I’m getting, but I cannot see how many sessions that represents. And without that, I don’t have a good metric for concurrent users.
You can supplement this with APM and RUM, which are covered in the Jira Monitoring post I did, so between everything you should be able to cover most bases.
However, JMX monitoring will still allow me to monitor vital states like Heap Size, Uptime, and Mail Status, so there is that.
Your thoughts?
It’s mostly a straightforward process, but as I said, the tricks are in the small details you need to change. However, I now have guides for setting up JMX on both Jira and Confluence; what system should I set up next? Do you have any stories about times good Monitoring saved your system before anyone else could notice? I’d love to hear about them!
You can find my social media links on my Linktree. You can also find links on there to donate directly to me or sign up for Patreon! Any money given goes directly to support and grow the blog, so it is appreciated!
You can also sign up below for our mailing list. This will automagically send you an email with new blog posts as soon as they are published.
But until next time, my name is Rodney, asking, “Have you updated your Jira issues today?”
Discover more from The Jira Guy
Subscribe to get the latest posts sent to your email.
