
Paid Partnership with Tempo
A little under a week before this went live, I sat in a briefing with three people from Tempo: Will Fitzgerald ran the platform walkthrough, Tim Donovan talked roadmap and strategy, and Sarah Hempel handled the partnership side of things. The pitch, from Will: something called Workforce Intelligence, which attributes AI costs from providers like Anthropic and OpenAI directly to Jira work items, aiming to give engineering leaders a defensible audit trail for cost capitalization and a way to check whether AI spend actually lines up with strategic priorities. The stated goal was to finally show leadership what they’re getting for AI spend, across three angles: return on investment, cycle-time improvement, and adoption.
If your eyes glazed over — don’t worry, I had to fight that too. To put it in everyday language, Workforce Intelligence is saying this: given how much we’re paying for AI tooling, what are we actually getting out of it?
The problem statement behind it is one every admin has heard some version of by now, even if nobody’s put a name on it in your org yet: leadership wants more AI adoption, but finance doesn’t want that effort to drive you bankrupt, and everyone above the rank-and-file is stuck asking some version of “what did we actually get for this?”
This isn’t some imagined scenario. We’ve seen several examples of this already — Uber announced in June that it had run through its entire 2026 AI budget by April, and now caps what an engineer can spend on tools like Cursor and Claude Code at $1,500 per tool, per month. Or take the U.S. Army, which in May 2026 opened up what its Chief Information Officer’s office pitched as effectively unlimited generative AI access, backed by a 100-million-token annual enterprise subscription to a platform called Ask Sage. Yet the pool meant to last the Army all year was empty within about six weeks, and the “unlimited” tap got shut back off almost as fast as it opened.
Tempo isn’t wrong that this tension exists. Will also walked through some of Tempo’s own internal usage numbers during the demo. Two things impressed me. First, I was struck that they showed me real production numbers at all, not a sanitized synthetic demo. That’s a rare level of trust in their product. Second, the scale of their spending surprised me for a company their size. I obviously can’t share the specifics; they’re not mine to publish. But the fact that a company that size needs its own product to track its own AI spend tells you something about where the rest of us are headed.
So, this isn’t just a straight product review of a dashboard I watched someone click through. Let’s face it, as a Jira Admin I see plenty of people do that. No, instead I’ll be drilling down to answer three narrow questions.
- Are the things Tempo claims to measure actually measurable at all? That is to say, is there a valid methodology underneath, or is it assumptions dressed up as data?
- If we agree it’s measurable, does Tempo’s specific implementation actually deliver that measurement, or is it a clean dashboard that is cleverly hiding the gaps?
- Assuming the first two hold up, do these metrics keep meaning anything once a team’s AI use goes from partial to total usage?
There are some metrics in here I have real doubts about. There are others I think are genuine wins, and I’ll show my work on why. But at the bottom of it all, I do think this finally answers the question: is there real evidence that AI coding tools are worth what they cost, or are we all still running on invoices and vibes?
(A bit more on what that partnership does and doesn’t cover: Tempo gets a look at this draft before it publishes, to flag anything factually wrong or anything from their confidential briefing materials I shouldn’t have used. They don’t get to change my conclusions. If something in here doesn’t sit right with them, you’ll hear about that too, not just the parts that do.)
Question One: Can Any of This Be Measured in the First Place?
Before asking whether Tempo measures this well, it’s worth asking whether anybody does. And the honest answer, across the whole category, is that the evidence base here is thinner than the confidence level suggests.
Start with the demand side, because it explains why a product like this exists at all. Kyndryl’s 2025 Readiness Report surveyed 3,700 senior leaders across 21 countries and found 61% feel more pressure than a year ago to prove ROI on AI investments. Benchmarkit’s 2025 State of AI Cost Management report, based on 372 enterprise respondents, found 85% of organizations miss their AI infrastructure cost forecasts by more than 10%. Neither of those numbers is independently audited by me, and both come from firms with something to sell around the problem they’re describing, so you should take their answers with a small boulder of salt. But even then, their findings match what we hear from the larger world: nobody budgeted for this correctly, and nobody’s sure what the spend actually bought.
Which brings me to the number I was actually given. During the briefing, Will cited internal Tempo data showing a 66% faster delivery rate for work items using AI tools compared to non-AI work. That’s Tempo’s own production data, from a company that clearly stands behind its methodology, and I have no particular reason to doubt it. That said, I for one would be deeply interested in the process behind it, because how a statistic is derived has an enormous impact on how you read it.
This is the same criticism I hold against Atlassian. “Over 150 billion objects and relationships” in the Teamwork Graph is an impressive-sounding figure, but until I know what counts as an object, what counts as a relationship, and why those two are being added together in the first place, it’s about as useful as any other number missing its unit.
There’s a line Adam Savage made famous on MythBusters, though he’s been careful to credit it to Alex Jason, a ballistics expert who worked on the show: the only difference between screwing around and science is writing it down. That’s not a shot at Tempo. It’s the standard I’d apply to any number in this category, including the ones I’m going to generate myself later in this post. Whether AI helps isn’t really the question — it plainly does, sometimes, in some hands, for some tasks. The question is whether somebody wrote down what they compared against, in a form the rest of us can check. That’s the difference between a number you can hand your CFO and a number you can only tell them about.
And the category isn’t settling this question either. Tempo’s public-facing materials describe the ROI-attribution gap in roughly “fewer than one in three organizations” terms, while a separate briefing document cites specific figures from three different research firms on how many organizations can currently measure AI ROI: KPMG at 7%, Deloitte at 15%, Protiviti at 47%. Those three don’t average into “fewer than one in three” in any straightforward way, and they don’t agree with each other either — which says less about any one firm’s methodology and more about how genuinely unsettled this is as a category. Credit where it’s due: KPMG, Deloitte, and Protiviti are the actual sources behind those percentages. Tempo is only the one citing them. But if three major firms can’t get within 40 points of each other on how many companies can measure AI ROI, we should hold any single number about AI ROI loosely.
Where It Genuinely Is Measurable
So let me show my own work instead of taking anyone else’s on faith.
There’s a documented convention for recording that more than one party wrote a commit: a Co-authored-by: trailer at the bottom of the commit message. GitHub documents the format itself, and it long predates AI — it exists because pair programming needed a way to credit two people for one commit. Claude Code writes one of these by default. Pair that with the issue key most of us already put in the commit subject, and you get a chain nobody has to self-report.
Here’s one from my own homelab, public and checkable: commit ab5495d in tjg-homelab/ansible-role-mysql, merged as PR #2. The subject line opens with AN-47, which is a work item key on my personal Jira Cloud instance. The bottom of the message carries a co-author trailer. That’s enough to establish, mechanically and without anyone filling out a timesheet, that this work was multi-party authored, that it belongs to AN-47, and that AN-47 belongs to the AN project. Roll that up to the epic and you have a portfolio number that traces back to specific lines of code.
And that key isn’t doing anything exotic. It’s the same link Atlassian’s development integration has relied on for years: put AN-47 in the branch name, the commit message, or the pull request, and the work surfaces in that issue’s development panel — along with any build that consumed the commit. Most shops running a Bitbucket or GitHub integration already have this wired up and have for a long time. Which is worth being plain about: the “which work item” half of this problem was solved years ago, by plumbing you already own. Tempo didn’t invent that, and isn’t claiming to.
It also means the attribution is exactly as good as your team’s commit hygiene. No key in the message, no link, no number. That part lands on you, not the vendor.
That’s the half I can prove. Whether AI made me faster on AN-47 is a question I’d answer from memory and mood, and I wouldn’t trust my own answer. Whether AI touched AN-47 is a question git answers, in public, without asking my opinion.
What that chain doesn’t tell you is how much. The dollar figure lives on the provider’s side, in Anthropic’s or OpenAI’s usage data, and nothing in that commit message says what the session cost.
It does carry something else, though, and I didn’t appreciate it until I went back and looked properly. That trailer isn’t my GitHub identity — my GitHub account isn’t tied to that address at all. It’s the email on my Claude account. Claude Code wrote that change from the ground up and signed the commit, in public, with the identity of the AI account that did the work. GitHub’s own documentation is explicit that the trailer only counts as attribution when the email matches a GitHub account, so as far as GitHub is concerned that line credits nobody. It isn’t there for GitHub. It’s a Claude-side identifier sitting in a public commit message.
Two things Will confirmed sit on either side of that. First, Tempo has provider-side visibility into Anthropic and OpenAI usage — who consumed which tokens, and when. Second, it reads commit messages to attribute work to items and projects, which is exactly what AN-47 in that subject line is for.
Everything to this point I can show you. What comes next is me guessing at how Tempo performs the trick, and I know for a fact I don’t have the full picture, so don’t take it as gospel. The provider knows a given account burned some number of tokens between 9:14 and 9:41 on a Tuesday. Git knows a commit carrying that same address landed at 9:43, with AN-47 in the subject. If those two halves meet on identity and timestamp, you get a dollar figure attached to a Jira work item without a single human estimating anything — and that’s a stronger version of the pitch than the one I got in the room.
It also relocates the hard problem rather than solving it. The join is only as good as the allocation rule underneath it, and nobody has walked me through that rule yet. One AI session doesn’t map cleanly onto one commit. A session might produce five commits, or one, or none at all — reading code, chasing a dead end, getting talked out of an approach. Tokens burned in a session that never produced a commit have nothing to attach to. Tokens burned in a session that produced five have to be divided among them somehow, and how you divide them is a methodology choice that quietly changes every number downstream of it.
Which lands us back at Alex Jason’s line. The mechanism is real. Whether the rule behind it is written down anywhere I can check is the question I should have asked in the room, and it’s the first one I’m asking now.
They Wrote It Down
So I asked. The answer came back with a document attached that Tempo had published the week before: the full attribution method, worked example and stated limitations included. The thing I said I wished I’d asked for already existed. I just hadn’t gone looking for it.
Two things it establishes straight away. The cost itself is never inferred — every dollar comes from the provider’s administrative API, what Anthropic or OpenAI actually billed, per person, per day. Tempo doesn’t model or estimate that figure, which means the totals reconcile against your invoice. And the identity matching is deterministic: exact email match, normalized for case and whitespace, with no fuzzy or name-similarity matching at all. Their stated reason is the right one — a wrong match would put an error into a financial record.
The join I reasoned my way to is real. It’s just the fallback rather than the design, and the weakness I flagged in it is one Tempo names themselves.
Path A is the default, and it’s day-level. A person’s spend for a day gets distributed across the work items they touched that day, weighted by lines changed — additions plus deletions, straight out of commit metadata. Their worked example: Alex burns $50 on a Tuesday across two tickets, 180 lines on PROJ-123 and 120 on PROJ-456, so $30 lands on the first and $20 on the second. If a day’s commits carry no measurable size — a run of merges or reverts — the money splits evenly instead. Work item keys come from the branch name, the commit message, or the pull request title, which is the same plumbing I walked through above.
Path B is the one I didn’t know existed, and it answers the question directly. A developer runs a one-time setup command that installs a lightweight hook into Claude Code. From then on, each session reports the git branch and commit SHA it ran against. The work item isn’t inferred at all — the session declares it. It’s opt-in, can be enabled per team, and can be removed whenever.
That’s the allocation rule I said would quietly change every number downstream of it. It’s written down, it’s arithmetic anyone can check, and for developers who install the hook, the inference disappears entirely.
There’s a second thing in that document worth pulling out, because it untangles something I’d run together. Whether AI touched a work item is a separate question from where the cost landed, and Tempo answers it with a separate signal: the co-author trailer. They read it straight from source control and recognize 22 tools, Claude Code among them. Which is to say the mechanism I went digging for in my own repository is the one they were already using. I just found it from the other end.
And then the part that earns the most credit, because nobody made them do it: they state their own limits. The money is measured; the placement is allocated. Days bucket in UTC, so distributed teams will see work land either side of a boundary. Path A spreads a person’s daily spend across everything they touched, including work that wasn’t AI-assisted at all — and they say so in their own document rather than letting a customer discover it.
That last one is a real concession, published voluntarily, in a form somebody else can check. It is, precisely, the difference between a number you can hand your CFO and a number you can only tell them about.
So: is this measurable in principle? The authorship trail, myth confirmed. The cost join, myth plausible — and that’s the part I’ll be checking myself once it ships.
Question Two: Does the Implementation Actually Deliver It?
Take the pitch at face value for a moment, because it’s a reasonably clean idea.
Workforce Intelligence connects natively to Claude Code, GitHub Copilot, Codex, Git, and Jira. Human effort and AI activity get logged as separate entries on the same Jira work item rather than blended into one number, so in theory you can see whose hands, be they made of carbon or silicon, actually touched a given piece of work. Cost then rolls up from the individual issue to the epic to the portfolio, which is the part aimed squarely at finance: instead of an analyst building an estimate in a spreadsheet, they get a number they can classify as CapEx or OpEx and hand to an auditor. Tempo’s own public description of the product frames this explicitly as replacing assumption with evidence.
Tempo positions this against six named competitors in its own public buyer’s guide: Jellyfish, DX, LinearB, Swarmia, Waydev, and Faros AI. Its stated differentiator is granularity — most of that category measures AI adoption at the team or tool level, and Tempo’s pitch is that it’s the only one tying blended human-and-AI effort to the individual Jira work item. If that holds up under use, it closes a real gap for anyone running “Just Jira” as their system of record.
My next question was an obvious one to anyone who has ever a) worked with developers, and b) played tabletop games. Simply put: what stops a team from gaming these numbers once everyone knows what’s being measured?
Anyone who’s sat across from a rules lawyer knows the answer is “nothing, eventually.” Point a metric at a sufficiently clever group and they will min-max it, and let’s face it, most developers qualify as sufficiently clever. We’ve watched it happen plenty of times already: playing games with story point estimation, padding line counts, maximizing pull request numbers, and most recently tokenmaxxing — burning tokens on the theory that heavy AI consumption must eventually produce better outcomes. IBM notes that organizations which stood up AI usage leaderboards found people learned to game them almost immediately, which surprises exactly nobody who has read this far.
Will’s answer was that the system detects AI usage through direct source control contributions rather than relying on anyone to self-report hours — reading commit-level signals instead of taking a team’s word for it. That’s a reasonable first line of defense against the most obvious kind of gaming, and it’s a meaningfully better answer than “we trust the timesheet.” But he then honestly added, almost as an afterthought, that no system is entirely tamper-proof.
It also draws a boundary around what the tool can see. Effort that never lands in a commit — reviewing and rejecting an AI’s first attempt, the judgment calls that keep bad generated code out of the repo, the Jira admin and config work underneath all of it — presumably doesn’t register. That’s not a flaw so much as a scope statement, but it’s one worth saying out loud before anyone reads a Workforce Intelligence dashboard as a complete picture of who did what.
The Money That Doesn’t Land on a Ticket
The sharper version of that question, and the one I wish I’d thought to ask in the room: can Workforce Intelligence account for AI usage that never gets attributed to a work item at all? Plenty of real AI spend never touches a ticket. A chat window open on a second monitor, an exploratory session that went nowhere, a stray one-off task — none of that has anything for an attribution engine to hang onto. If that spend simply falls off the map, then every number the product produces is describing part of the bill while looking like it describes all of it.
I put it to Tempo after the fact, and got a real answer with actual math behind it, using one of their own examples (randomized data, not a live customer’s numbers). Their executive dashboard tracks spend in three layers: Total AI Spend, In-Scope Spend, and Attributed Spend. In their example: $152,918.40 total, $107,042.88 in scope for work-item attribution, $90,986.45 actually attributed to a specific issue.
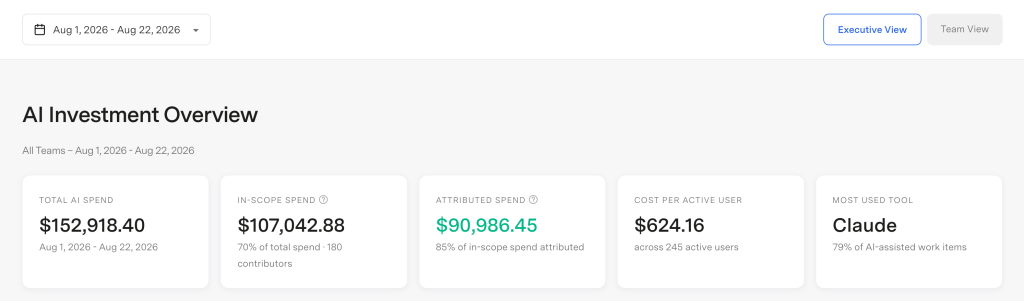
The roughly $62,000 gap between total and attributed doesn’t vanish. It still rolls up to a team or a person even when it can’t be tied to a ticket. Their example shows why that matters: Product Management appears in the team breakdown with a real spend figure, $11,239.52, but no adoption or cycle-time numbers at all, because that team’s work doesn’t map onto engineering-style tickets the way an engineering team’s does. That’s an honest way to handle the gap rather than pretending it isn’t there, and frankly it’s more than I expected them to have built already.
It doesn’t fully close, though. Of the money that is in scope for ticket-level attribution, $16,056.43 — 15% of it — still isn’t tied to a work item, and the answer I got didn’t go that far. That’s a smaller number than the headline $62,000, but it’s the part that actually matters for the ROI question: it’s engineering AI spend, on teams whose work is supposed to map to tickets, that doesn’t. What’s inside that 15% — exploratory sessions, work done before a ticket existed, spend that hasn’t synced yet — is the next thing worth asking about, and I’m asking.
The Part That Touches a Financial Statement
I called this a reporting layer earlier. Tempo pushed back on that, and having sat with it a moment, I have to admit their objection was fair. I had completely speedrun through the most impactful feature, and it has nothing to do with a dashboard at all.
Fair warning: this is the finance bit. You mention words like OpEx and CapEx and my eyes’ default behavior is to glaze over. But if you have ever argued with procurement about whether a server comes out of this year’s budget or gets spread across the next five, you already understand the whole idea and the rest is just vocabulary.
The way it got explained to me is owning versus renting. Buy the server and it’s an asset on your books: you carry it, and the cost gets spread across the years you actually get use out of it. Rent the same compute and there’s no asset at all — the money is out, counted against this year, done. Same capability either way, completely different treatment on the financial statements.
AI spend today is renting. It’s a SaaS bill, it hits this year’s P&L, and that’s the end of it. But work that builds software can, under the right conditions, be treated as the other kind: capitalized, carried as an asset, spread across the years you get value from it. For an organization spending seven figures a year on AI tooling, that doesn’t end up as a rounding difference. That’s whether this year’s numbers look rough or fine.
So, what are the situations that allow this conversion? EisnerAmper’s guidance on AI consumption costs reads the relevant standard to allow capitalizing tokens spent on development-phase work — but only where each token expense can be clearly associated with the specific thing it helped build. A general allocation spread across a pile of work doesn’t qualify.
Now go back and read what Tempo published. Their words, not mine: the money is measured, the placement is allocated. Path A takes a day’s spend and spreads it across everything a person touched, weighted by lines changed. That is an allocation. Path B, where the session itself declares the branch and commit it ran against, is an association.
Disclaimer: I’m a Jira admin, which is to say I’m neither a lawyer nor an accountant. If you make a capitalization call off a blog post, you probably deserve whatever your auditor does to you. But if you’re the one who gets pulled into the meeting where this comes up, that distinction is what your finance people will care about — and it’s the best argument I’ve seen for turning that hook on.
So on question two, I’d call this a qualified yes. The attribution mechanism is real, the gaming defense is sensible, and the unattributed-spend problem is one they’ve clearly thought about rather than papered over. The 15% is an open thread, not a disqualifier.
Question Three: Do These Metrics Survive Success?
Here’s where I have actual concerns, and they’re not about whether the product works. They’re about what happens to these numbers when a team does exactly what leadership is pushing them to do.
What Happens When the Comparison Group Shrinks
Tempo’s ROI and cycle-time figures rest on a live comparison: work items that used AI measured against work items that didn’t, inside the current period. My assumption going into the meeting was that it compared against a historical baseline — before-AI versus after-AI — and Tempo corrected me directly. It’s a running comparison, not a before-and-after.
That’s a sensible design for a team in transition, and it’s the design that produces a number like Will’s 66%.
Now run it forward. I don’t believe AI usage in a real org ever hits a literal 100%; there’s always something somebody does by hand.
A task might be so small as to not be worth the token. I’ve seen this a few dozen times in my own inventory audit in the homelab. I could spend tokens to have Claude transcribe a picture from my phone, understand its context, inject that data into the right place in Confluence, and while it’s at it add another 25 lines’ worth of what I’m sure it feels is important context. Or I can actually type something out myself.
A task might be so unique or strange that by the time I’ve typed out everything to understand the use case and all its edges, negotiated with the AI about what I really mean, corrected it a few dozen times, and still not landed on something entirely correct, I could have been done with the task myself.
Or it could be something a human is genuinely trying to understand themselves, and the only way to learn is to get dirty. Or the human can be just weird and enjoy the task. It takes all people, after all.
But here’s the point: you don’t have to reach 100% AI adoption before it starts affecting your statistics. It only has to climb high enough that what’s left over stops being a usable sample — and with enough budget behind an adoption push, that’s a reachable place.
This isn’t a Tempo problem. It’s a statistics problem. Two things go wrong when it gets there, and only one of them is about sample size.
The obvious one: a comparison group of a dozen work items in a quarter can’t carry a percentage claim about engineering productivity. That’s just statistics.
The one that worries me more is that the leftover non-AI work isn’t a random sample. It’s a selected one. As adoption climbs, the work that stays manual stays manual for a reason — trivial enough that nobody bothered, sensitive enough that nobody risked it, or strange enough that no model helped. Those aren’t average work items. They’re the specific residue of everything people chose not to hand to a machine. Measuring AI-assisted work against that residue isn’t merely an underpowered comparison; it’s a biased one, and I can’t tell you which direction the bias runs.
If you’ve heard the story about armoring WWII bombers, this is that trap — survivorship bias — wearing different clothes. Analysts mapped where returning planes had taken fire and proposed reinforcing those spots. Abraham Wald pointed out what nobody had said out loud: those are the planes that made it back. The holes they came home with are, by definition, the survivable ones. Armor the places with no holes, because the planes hit there weren’t around to be measured.
The non-AI pile is the same shape of problem. It isn’t a random slice of your work. It’s what an invisible selection process left behind, and reading it correctly means asking what AI took, not just measuring what’s still sitting there.
So the number doesn’t just get noisier as adoption succeeds. It gets quietly unreliable while still rendering clean on a dashboard.
To be fair to Tempo, that’s a property of live-comparison metrics generally, not an accusation about their build — anyone designing this way inherits it. What I don’t know is what they do about it: fall back to a peer team, an org-wide average, a last-known baseline, or flag the comparison as unreliable below some threshold. I’ve asked. I’ll update this post when I have an answer.
Adoption Hits a Ceiling
Adoption has the same problem wearing a different shape. Once a team is fully AI-first, adoption sits near 100%, which means it stops being an actionable signal at exactly the moment leadership presumably cares most about it. A number that can only go up until it can’t isn’t telling you anything after it arrives.
There’s a second issue underneath that. If adoption becomes a number that gets tracked and reported upward, teams pick up a quiet incentive to reach for AI regardless of whether a given task calls for it. That’s a Goodhart’s law problem, and it sits awkwardly next to the other half of Tempo’s own pitch, which is cost control. You cannot simultaneously reward people for using more AI and for spending less on AI without eventually making someone choose.
I’ll cop to this one myself. That inventory audit I mentioned earlier: I caught myself about to hand an AI a stack of photos of network hardware and have it transcribe MAC addresses and serial numbers into my asset registry — a five-minute job, one I’ve done by hand a hundred times. By the time I’d factored in checking its transcription against the photos, it would have taken longer and burned more tokens than just typing the numbers myself. I stopped that time. I don’t always. And I’d bet real money this happens inside companies everywhere, every day, in ways nobody’s tracking, because reaching for the AI tool has quietly become the default instinct rather than a judgment call.
An adoption count built from active users or session totals can’t tell that apart from a task where AI genuinely helped. It knows the tool got used, not whether using it made any sense — the same blind spot “lines of code” has always had as a productivity metric.
Cost Per Work Item Is the One That Holds Up
Thinking about it more, though, I don’t think that specific kind of waste needs its own flag to catch. Transcribing photos is already an expensive way to feed a model — image input costs more than text, and checking its work adds more time on top. A well-segmented cost-per-work-item number should catch a task like mine on its own: high cost, almost nothing to show for it on that issue.
That’s the metric I think genuinely survives, with one condition. A single blended cost-per-work-item figure hides that a one-line bug fix and a multi-file refactor cost wildly different amounts in tokens. Average those together across a mixed workload and you get something close to a Simpson’s paradox result: a number that looks stable and means very little. Segmented by work type, it becomes a real signal.
And critically, it’s the one metric here that doesn’t need a live non-AI control group to keep working. You can trend cost-per-work-item-by-type over time within a single team without needing any comparison population at all. It survives the exact scenario that kills the other two.
I pulled the per-model discussion out of this post, because that feature isn’t in the launch build. But Tempo offered something better than a feature: a decision. They tested Opus against Sonnet, looked hard at moving to Claude Fable 5 when it shipped in June, and decided against it — on cost-per-work-item data, about their own money. That’s the question I’d actually been wanting an answer to. A pricier model that gets there in one pass versus a cheaper one that needs three tries: the per-token price tells you almost nothing, and the cost of the finished work item is the only number that settles it.
The honest caveat across all of this: I don’t yet know which pieces are live in the product today versus sitting on the roadmap. Will and Tim both confirmed the shape of that roadmap directly — attribution accuracy first, suite integration and governance features next, broader orchestration after that — and it tracks closely with their pre-briefing materials, which at least tells me the plan hasn’t shifted since the deck was written. It also means some of what’s described above may not be something you can click into on day one. Worth confirming what’s live before you build a business case on it.
Who This Is Actually For
The pitch breaks the audience into four roles: an economic buyer (CTO or VP Engineering) who signs off, a primary user (an engineering team lead) who lives in the dashboard weekly, a contributing user (the engineer whose Claude Code and Copilot sessions are literally what’s being measured), and an executive user (CEO or CFO) who wants the one-line summary at board level.
There’s a broader read available here, though. Tempo started with Timesheets, then assembled the rest over the past few years: Structure, Roadmunk, Custom Charts. Time tracking, hierarchy, roadmapping, reporting — that isn’t a random shopping list, it’s most of a portfolio management layer sitting above Jira. Workforce Intelligence lands in that portfolio as the piece that tells you what the work cost. Whether Tempo eventually surfaces all of it somewhere above the individual apps is speculation on my part, but it’s the direction the acquisitions have pointed for years.
Translated into “Just Jira” terms, the practical question for most of my readers is simpler: is this a tool you’ll ever configure yourself, or a data source someone above you is going to ask you to feed? My read is closer to the second. This isn’t a permission scheme or a workflow you’ll maintain day to day. It’s a reporting layer sitting on top of Jira data you’re already responsible for — which means your actual stake in it is making sure the underlying issue data (accurate assignment, correct issue type, honest linking) is clean enough for the attribution to have something real to work with.
Feed it a messy instance and it’ll produce a confident, clean-looking number about nothing. That’s not a knock on Tempo. That’s every reporting layer ever built, and it’s the part of this that lands on your desk regardless of who signs the contract.
Wrapping Up
Back to the three questions.
Is it measurable? The authorship trail, demonstrably. The cost join, plausibly, pending an allocation rule nobody has shown me. Does Tempo’s implementation deliver it? Better than I expected, with a real answer on unattributed spend and a 15% slice I’m still asking about. Do the metrics survive success? The comparison-based ones — ROI and cycle time — get less trustworthy the better adoption gets, and adoption itself stops saying anything once it saturates. Cost per work item is the one that doesn’t need a comparison group to keep working, which makes it the one I’d want any vendor in this category to be able to show working today.
Which leaves the bigger question I opened with: is there real evidence that AI coding tools are worth what they cost?
Right now the only people who can answer that are Tempo, and that stays true until the product is in other people’s hands. But it’s worth being clear about what they did with that position. They ran this on themselves first — not a demo tenant, not synthetic data, their own production spend. Then they opened it up to someone outside the company and let me look. That’s more than most vendors will do with a number they’re proud of, and considerably more than any of the research firms cited earlier in this post have done with theirs.
So no, I can’t independently verify it yet, and neither can you. What I can tell you is that their own numbers appear to have convinced Tempo, and they’ve built the instrument that would let the rest of us check ourselves.
Here’s the five-minute version you can run yourself, no product required: open your Jira instance right now, pick one AI-touched issue closed in the last month, and try to answer what it actually cost and what it actually produced. Most admins will land on “I have no idea” — which is exactly the gap this whole category exists to fill.
I’m working on my own version of that test: two accounts on my own instance, one mine and one wired to an AI tool, specifically so I can eventually point Workforce Intelligence at real, messy data and see whether its numbers match what actually happened. Tempo’s internal testing sandbox is still a few weeks out, but that’s not the door I’m planning to walk through. Atlassian’s standard Marketplace licensing gives every paid cloud app a 30-day free trial by default — that’s an Atlassian policy baked into the commerce layer, not a favor any individual vendor grants — so once Workforce Intelligence is actually listed, I don’t need Tempo’s permission to point it at my own instance. That hasn’t happened as of this post going up. When it does, I’ll publish exactly what I found, whether it makes Tempo look good or not.
I’m curious whether your org can already answer “what did the AI actually deliver here?” — or whether you’re in the same spot I am: staring at an invoice and a Jira board that don’t yet talk to each other.
Until then, this is Rodney, asking: have you updated your Jira issues work items today?
Enjoyed this one? These posts are free and always will be — but if this saved you a headache or taught you something worth keeping, you can drop a tip in the Ko-fi jar. No paywall, no subscription, no catch. Just a thanks if the writing earned it.
→ Support The Jira Guy on Ko-fi
Discover more from The Jira Guy
Subscribe to get the latest posts sent to your email.


