Well, readers, it’s been a few weeks. It’s not entirely been by choice. The first week, I got all my testing and data together, and then….nothing. I literally could not get the words to start. Honestly, I was on the cusp of a long weekend and might have had vacation-brain a bit early.
However, last week – let me tell you about last week. The previous week (see vacation-brain comment), I went to see my Mom and younger brother attend his high school graduation. Yes, he is that much younger than me.
However, they live in Alabama – which anyone who lives there can attest is not taking COVID as seriously. This means, of course, I catch it while I’m there. Not that I say I regret going, it is what it is. But the first day I feel ill is Wednesday, which means no blog post for me. I came through it relatively easily, aside from a single scarily low blood pressure reading. Which I would get at Urgent Care before I knew I had COVID.
So that’s where I’ve been. But boy – in that time, we’ve had a lot happening. To review:
1) We’ve had the Data Center AMA. Don’t worry; I have something in the works for that. However, I wanted to get a bit more before I publish something, so I will hold off that post a bit longer. It will be worth it, I promise.
2) In speaking of Security updates, we’ve had a massive Zero-Day exploit discovered in Confluence. Unfortunately, this CVE came in while I was at my sickest point last week, and I haven’t had a chance to double back onto it – but check your Confluence instances and GET. THEM. UPGRADED. I want to dig a bit deeper into this one, so that might be next week’s post while I wait for what I need on the Atlassian Data Center post.
So now that we have that taken care of let’s focus on what we are here for today.
An Interesting Quesiton
I had an interesting question come across my desk a bit back. In general, we know the sources of performance problems in Jira. For example, we know to limit the number of workflows, fields, and permission schemes. In addition, we know to look out for automations that might be doing massive changes and optimize our JQL queries, especially on boards.
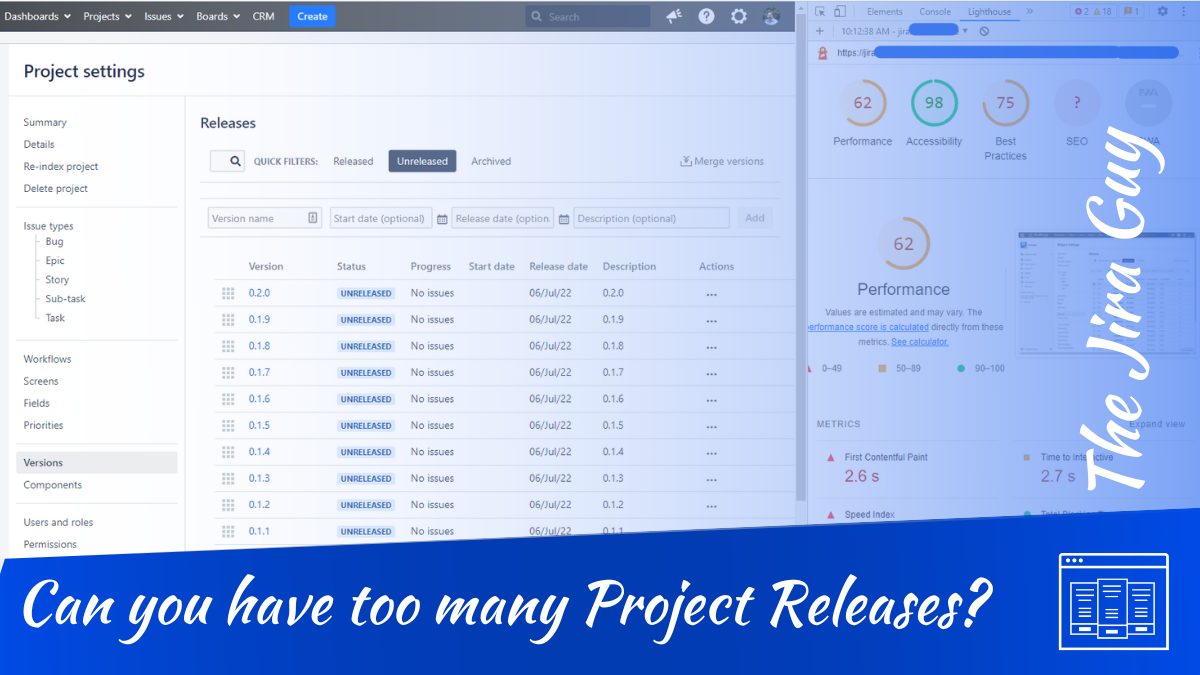
But this question had to do with something I don’t think anyone has ever thought to check. This group wanted to have their Project’s Releases automatically populated from the Source Control Management system. However, before they put this automation in place, they wanted to know what effect this could have on performance if left unchecked.
First, let me take a second and applaud this team. They recognized that while this could make their lives easier, they live on the platform with other teams and decided to check before doing something. Gold star, blue ribbons, and praise all around!
But secondly, this intrigued me. To my knowledge, no one has ever tested this. The main reason why is it’s well understood that having so many Releases could be painful when you try to update an issue with a new fix or affects version. And I do believe this team doesn’t intend their situation to get that bad, but they still wanted to know, if it did, what they could expect.
Now, my hunch was correct. Atlassian had nothing in their documentation about it, and when I asked them directly, they said they had never thought to look at it for performance issues. They said they thought it might be acceptable – aside for some slowness from the project itself, but unfortunately, given their priorities, it would be a while before they could test it.
Well, who am I if not “The Jira Guy?” If Atlassian had not the time to test it, I would make the time to test it myself! And that is precisely what we are focusing on today. Specifically, we will look at How I set up my test, what the results showed, and what I could do to get better information in the future. I’m hoping Atlassian can take this and use it as a launching board to provide more detailed information on this going forward.
Test Setup
So, how do you gauge performance? I’ve covered this before, and while there are many answers and no precise test that will satisfy everyone, I prefer to think of what the end-user feels. And the best tool I’ve managed to find for this is the Lighthouse utility built into Chrome. There are versions made for Firefox and Edge, but they are browser plugins and depend on an external server that might not have access to your internal sites. That is why I prefer the Chrome version – it runs in your browser, so it has access to whatever you do.

Lighthouse Generates a score of performance between 0 and 100, which higher numbers meaning better performance. Several metrics are measured behind the scene to generate this score, but it’s usually good enough to give us a baseline score for an “apples to apples” comparison.
So, to test this, I started with a blank Project (hereafter the “test project.”) I have several in my Jira test instance from a previous test, so I just grabbed one. I then grabbed a baseline “control” reading with no Releases on the project yet. I decided to grab three data points per page, with four pages tested per round. The pages are:
- The Issue Creation Screen for the test project
- The Release Management Screen in the Project Settings for the test project
- The Issue Creation Screen for a different used project
- The main Summary page for a different project
The tested pages were the same throughout all data points, and at each number of releases generated, I tested each page three times and took the average. This way, I hoped to average out random performance spikes and get a more consistent data set.

After I captured performance numbers for the Control (0 Versions Generated), I used API calls to generate 20 Versions and tested again using the same procedure and pages. Then again at 1000 Versions generated, 3440 Versions generated, and 10000 Versions generated.

I had used a CSV of unique version numbers for the dataset, which made it possible to use Postman to generate these results. To be clear – I don’t think this test could have been possible promptly without Postman.
The Results
So, before I started, I hypothesized that while the project with the releases might be severely affected, any performance problems would be limited to that project. In my discussions with Atlassian, this was their feeling too. So what did the data show? Let’s look!
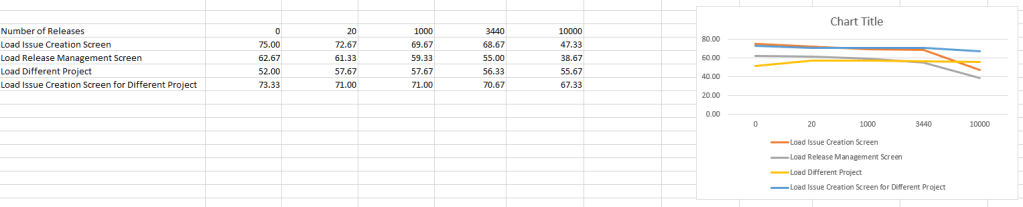
So, if we take the Control and the most extreme situation (10000 Versions), the project in question does take a sizable hit, with a 36.89% drop in performance for the Issue Creation Screen and a 62.06% drop on the Release Management Screen. Considering how much it had to load, this is hardly surprising. However, only at the most extreme end were the extreme effects felt. At the “still insane but slightly more reasonable” scale of 3440 Versions generated, we only saw an 8.44% drop in performance from the Issue Creation Screen and 12.23% drop on the Release Management screen. Honestly, I’m not sure those would be noticeable by most people.
However, the interesting bit was what happened to the other project. My hypothesis stated that the effects would be limited to the victim – err – test project. We saw a slight dip in performance on the second project throughout the testing, but it was nowhere near as bad as the test project at each step. In other words, the effects were not limited to the test but were not fully felt by other projects.
What would I do differently next time?
So – I added the 10000 Versions generated test case to the experiment to confirm the trend I thought I saw in the data. So, the first thing I would do if I did this test again is to redo the test for every 1000 versions generated. This approach would give us a more even scale to see what kind of function the performance drop gives us and thus might help us predict future numbers.
The second thing I would do is maybe see how the second project behaves when there is a third with this level of versions and maybe a fourth. See if having multiple projects like this has an additive effect on the performance of the project not being tested.
Then I’d also be interested in seeing how issue count also affects the performance. This would require a lot more testing but would give us a three-dimensional scale of how versions and issues interact with the performance.
Final Thoughts?
What did you think the result would be? Is there anything you’d do differently? Is there some other aspect of Jira Performance you’d also like me to test! Let me know!
You can find my social media links on my Linktree. So be sure to like, comment, and share the post on Social Media! It definitely helps the blog grow!
You can also subscribe to the blog below. Subscribing gets posts delivered directly to your inbox, and it’s the fastest way to get new posts!
But until next time, my name is Rodney, asking, “Have you updated your Jira issues today?”
Discover more from The Jira Guy
Subscribe to get the latest posts sent to your email.
