
So I ran into an interesting situation this past Monday. Apparently my Primary DNS had been down for at least a week. I went to go look at my network monitoring tool (LibreNMS) – and THAT was down too – for what I can guess is at least two weeks! Granted I haven’t been doing as much on my Homelab since early March when I went into the hospital, this was still not a good state of affairs.

So I decided to stand up a Nagios instance to monitor and alert when I have critical systems down. After getting it stood up, it didn’t take me long to start thinking about how I could use this with JIRA, which is now the topic we are going to cover today!
A bit of history
As you know, when I started my Atlassian journey, I was in charge of more than just JIRA. Nagios was one of my boxes I inherited as well. So I’m somewhat familiar with the tool already and how to configure it. I’ve had to modify things during that time, but never do a full setup. However, I knew I wanted to do more than monitor if JIRA was listening to web-traffic. So as part of the whole installation, I decided to dive in and see what she can do.
How to select what to Alert on.

Selecting what I want to be alerted for has always been a balancing act for me. You don’t want to have so many emails that they become worthless, but you don’t want to have so few that you won’t be alerted to a real problem.
The goal of alerting is to clue you into problems so you can be proactive. Fix back end problems before they become a user ticket. So I always try to take the approach “What does a user care about?”
They care that the system is up and accessible, so I always monitor the service ports, including my access port. So that’s three.
A user also cares that their integrations work. If your integrations depend on SSL, and your clock drifts too far out of alignment, those integrations can fail – so I want to check the system is in sync with the NTP Server.
A feature that users love is the ability to attach files to issues. This feature will eventually chew up your disk space, so I’ll also want to monitor the disk JIRA’s home directory lives on.
Considering I’m using a proxy, I’ll want to be sure the JVM itself is up, so I’ll need to look at that. I’ll also want to be sure that JIRA is performing at it’s best, and isn’t taking too long to respond, so I’ll want an alert for that as well.
Do you see what I’m doing? I’m looking at what can go wrong with JIRA when I’m not looking and setting up alerts for those. The idea here is I care about what my users care about, so I want the Nagios to tell me what is wrong before my users get a chance to.
So…configurations.
Now comes the fun part. Nagios’ configuration files is a bit much to take in at first. However, I will be isolating the Atlassian specific configurations to make things a bit easier on all of us. First, lets start with some new commands I had to add.
###############################################################################
# atlassian_commands.cfg
#
#
# NOTES: This config file provides you with some commands tailored to monitoring
#        JIRA nodes from Nagios
# AUTHOR: Rodney Nissen <[email protected]
#
###############################################################################


define command {
    command_name    check_jira_status
    command_line	$USER1$/check_http -S -H $HOSTADDRESS$ -u /status -s '{"state":"RUNNING"}'
	}

define command {
    command_name	check_jira_restapi
	command_line	$USER1$/check_http -S -H $HOSTADDRESS$ -u /rest/api/latest/issue/$ARG3$ -s "$ARG3$" -k 'Authorization: Basic $ARG4$' -w $ARG1$ -c $ARG2$
	}

define command {
    command_name    check_jira_disk
    command_line    $USER1$/check_by_ssh -H $HOSTADDRESS$ -l nagios -C "/usr/lib64/nagios/plugins/check_disk -w $ARG2$ -c $ARG3$ -p $ARG1$"
    }

define command {
    command_name    check_jira_load
    command_line    $USER1$/check_by_ssh -H $HOSTADDRESS$ -C "/usr/lib64/nagios/plugins/check_load -w $ARG1$ -c $ARG2$" -l nagios
The first two commands here are VERY tailored to JIRA. The first one checks that the JVM is running, all with a handy HTTP request. If you go to your JIRA instance and go to the /status directory, the JVM will respond with a simple JSON telling you the state of the node. You use this feature in JIRA Data Center, so your load balancer can determine which nodes are up and ready for traffic. Buuut…it’s on JIRA Server too, and we can use it for active monitoring. So I did. If JIRA returns anything other than {“state”:”RUNNING”}, the check will fail and you will get an alert.
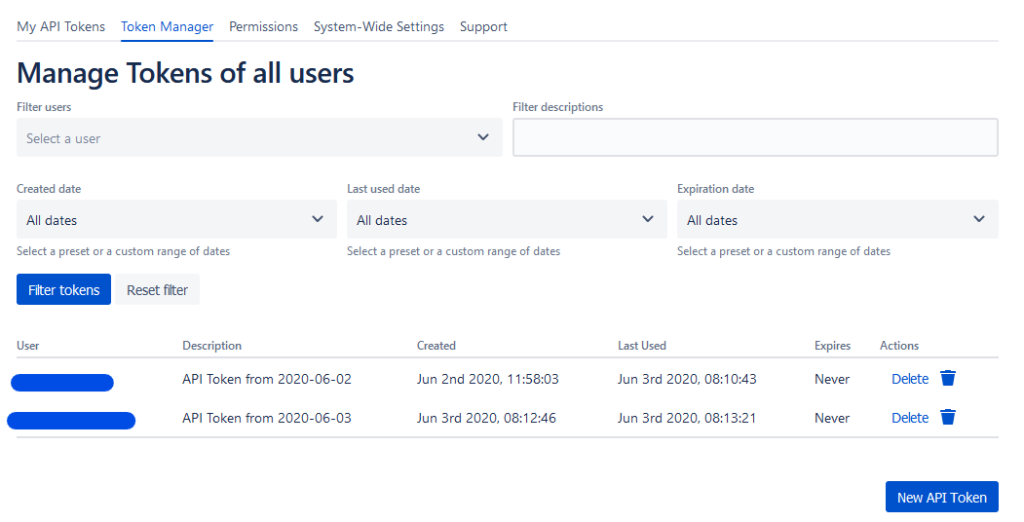
The second is a check on the rest API. This one will exercise your JIRA instance to make sure it’s working without too much load time for users. The idea here will search for a known issue key, and see if it returns valid information within a reasonable time. $ARG1$ is how long JIRA has before Nagios will issue a warning that it’s too slow (in seconds), and $ARG2$ is how long JIRA has before Nagios considers it a critical problem. $ARG3$ is your known good Issuekey. $ARG4$ is a set of credentials for JIRA encoded in Base64. If you are not comfortable just leaving your actual credentials encoded as such, I’d suggest you check out the API Token Authentication App for JIRA. Using the App will allow you to use a token for authentication and not expose your password.
The third commands here are for checking JIRA’s home directory ($ARG1). $ARG2$ and $ARG3$ are percentages for the warning and critical thresholds, respectively.
The fourth is for checking the system load. This one is relatively straight forward. $ARG1$ is the system load that will trigger a warning, and $ARG2$ is the system load that shows you have a problem.
Now for the JIRA host configuration:
###############################################################################
# jira.CFG - SAMPLE OBJECT CONFIG FILE FOR MONITORING THIS MACHINE
#
#
# NOTE: This config file is intended to serve as an *extremely* simple
#       example of how you can create configuration entries to monitor
#       the local (Linux) machine.
#
###############################################################################


###############################################################################
#
# HOST DEFINITION
#
###############################################################################

# Define a host for the local machine

define host {

    use                     linux-server            ; Name of host template to use
                                                    ; This host definition will inherit all variables that are defined
                                                    ; in (or inherited by) the linux-server host template definition.
    host_name               jira
    alias                   JIRA
    address                 192.168.XXX.XXX
}


###############################################################################
#
# SERVICE DEFINITIONS
#
###############################################################################

# Define a service to "ping" the local machine

define service {

    use                     generic-service           ; Name of service template to use
    host_name               jira
    service_description     PING
    check_command           check_ping!100.0,20%!500.0,60%
}


# Define a service to check SSH on the local machine.
# Disable notifications for this service by default, as not all users may have SSH enabled.

define service {

    use                     generic-service           ; Name of service template to use
    host_name               jira
    service_description     SSH
    check_command           check_ssh
}


# Define a service to check HTTP on the local machine.
# Disable notifications for this service by default, as not all users may have HTTP enabled.

define service {

    use                     generic-service           ; Name of service template to use
    host_name               jira
    service_description     HTTP
    check_command           check_http
}

define service {

    use                     generic-service
    host_name               jira.folden-nissen.com
    service_description     HTTPS
    check_command           check_https
}


define service {
    use                     generic-service
    host_name               jira
    service_description     NTP
    check_command           check_ntp!0.5!1
}

define service {
	use				generic-service
	host_name			jira
	service_description		JIRA Status
	check_command			check_jira_status
	}

define service {
	use				generic-service
	host_name			jira
	service_description		JIRA API Time
	check_command			check_jira_restapi!2!3!HL-1!<Base64 Credentials>
	}

define service {
	use				generic-service
	host_name			jira
	service_description		JIRA System Load
	check_command			check_jira_load!5.0,4.0,3.0!10.0,6.0,4.0
	}

define service {
	use				generic-service
	host_name			jira
	service_description		JIRA Home Directory Free Space
	check_command			check_jira_disk!<JIRA Home>!75%!85%
	}
So, first, we define the host. This section is information specific to JIRA. Then we start setting services for JIRA. Within Nagios, a Service is a particular check you want to run.
The next four options are pretty standard. These are checking Ping, the two service ports (HTTP and HTTPS), and the SSH port. The SSH Port and HTTP/S port checks will also check that those services are responding as expected.
The next check is for NTP. I have this setup to warn me if the clock is a half-second off and give me a critical error if the clock is off by one second. These settings might be too strict, but it has yet to alert, so I think I have dialed it in well enough.
The next is the JIRA Status check. This service will check /status, as we mentioned earlier. It’s either the string we are expecting, or it’s not, so no arguments needed.
After that is my JIRA API Check, which I set up to check the HL-1 issue. If the API Call takes longer to 2 seconds, issue a warning, and if it takes longer than 3 seconds, Nagios issues a critical problem. This alert won’t tell me exactly what’s wrong, but it will tell me if there is a problem anywhere in the system, so I think it’s a good check.
The last two services are systems check – checking the System Load and JIRA home directory disk, respectively. The Load I haven’t had a chance to dial in yet, so I might have it set too high, but I’m going to leave it for now. As for the Disk check, I like to have plenty of warning I am approaching a full disk to give me time to resolve it, so these numbers are good.
The last step is to add these to the nagios.cfg file so that they get loaded into memory. However, this is as easy as adding the following lines into the cfg file.
# Definitions for JIRA Monitoring
# Commands:
cfg_file=/usr/local/nagios/etc/objects/atlassian_command.cfg

# JIRA Nodes:
cfg_file=/usr/local/nagios/etc/objects/jira.cfg
And that’s it! Restart Nagios and you will see your new host and service checks come up!
Nagios in action.
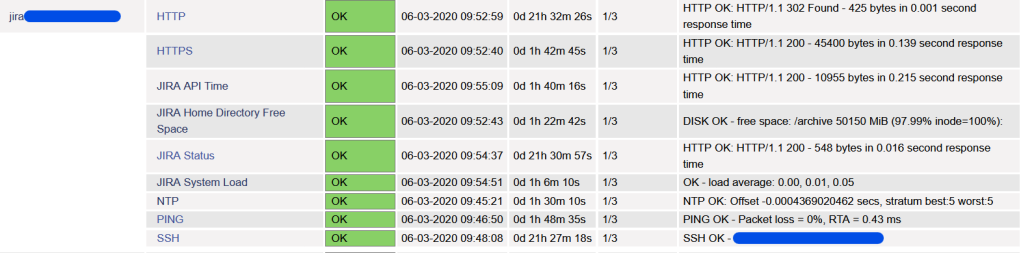
So I’ve had this configuration in place for about a day now, and it appears to be working. The API Time check did go off once, but I did restart the JIRA Server to adjust some specs on the VM, so I expected the delay. So I hope this helps you as you are setting up alerts for your JIRA system!
And that’s it for this week!
We did get a bit of bad news about Summit 2021 last week. Out of an abundance of caution, Atlassian decided to go ahead and make all in-person events of 2020 and Summit 2021 virtual events. However, they have almost a year to prepare for a virtual Summit – as opposed to the 28 days they had this year. So I am excited to see what ideas Atlassian has to make this a fantastic event!
Don’t forget you can check me out on Twitter! I’ll be posting news, events, and thoughts there, and would love to interact with everyone! If you found this article helpful or insightful, please leave a comment and let me know! A comment and like on this post in LinkedIn will also help spread the word and help others discover the blog! Also, If you like this content and would like it delivered directly to your inbox, sign up below!
But until next time, my name is Rodney, asking “Have you updated your JIRA Issues today?”

Hello, the proposals are very interesting, but I do have many questions. since I want to do the same.
you would be very helpful. Thank you.
LikeLike