
So, do you know what I’ve always found difficult? Figuring out which App in my Jira instance is causing me the most prominent performance hit. No, seriously! It is a known fact that on Server and Data Center deployments, each App you add will, in turn, cause some degradation of performance. It just comes down to the fact that your System now has to store more in memory and has more code to process.
But it’s one thing to know that, and it’s another thing to quantify that hit. But how do you do that? Well, today we are doing precisely that! I have found a method that I’m reasonably confident will measure the impact felt by actual end-users, and I want to share that with you today.
Chrome Lighthouse
The cornerstone of this testing is a tool that you very well may already have. Chrome Lighthouse is a benchmarking tool that lets you look at various statistics related to your web page loading. The vital thing to note here is that it also gives you a score from 0-100 on how your Jira instance is loading. Furthermore, it’s scaled such that the higher your score, the better your System is doing.
Where can you find such a tool? Well, if you are running Chrome, it’s already built into your browser! I should note that if you are running Firefox or Safari, Lighthouse is also available – kind of. The version for these browsers interact with a remote host to do benchmarking, which means if you are on an intranet-only website – like most Jira instances – it will fail. But on Chrome, it runs locally, meaning you can get some real insights into your Jira instance.
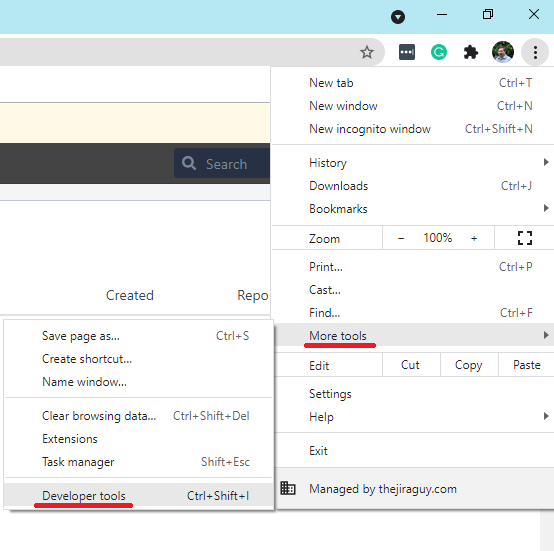
To get to the tool, you need to click your ellipses menu, then More tools -> Developer Tools.

Once you have your Chrome Developers tools open, click the double arrow icon, then select “Lighthouse.” From there, you can click “Generate Report” to benchmark the current page you are on.

To be clear, I’m not sure how each statistic is weighted in that Performance score. And depending on your userbase, different stats may matter more to you. But the point is whichever metric matters to you, you know, have a reliable way to test it – which means we can now start playing with variables. Variables like, say, how many Apps are loaded.
Marketplace App Testing Procedure
Running the test
So, now we have our tooling, how do we use it to test?
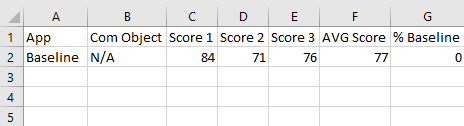
To start with, we need a good test page. This page should be something that takes Jira some time to process. I’ve selected the queue page for a JSM project I made a few months back in my Jira test instance. As things stand now, this page scores a 70 with all my Apps loaded. It’s not bad, but it’s not great, which is perfect for this test. You must use the same page for each run, as doing so will eliminate the variable, thus preventing people from saying that your page selection influenced the results. You should also consider a page that isn’t a part of an App; as for our first test, we’ll be running with all Apps disabled.
Just a note here: If you are using SAML SSO for your authentication, this will also be disabled, so plan accordingly and use your local account.
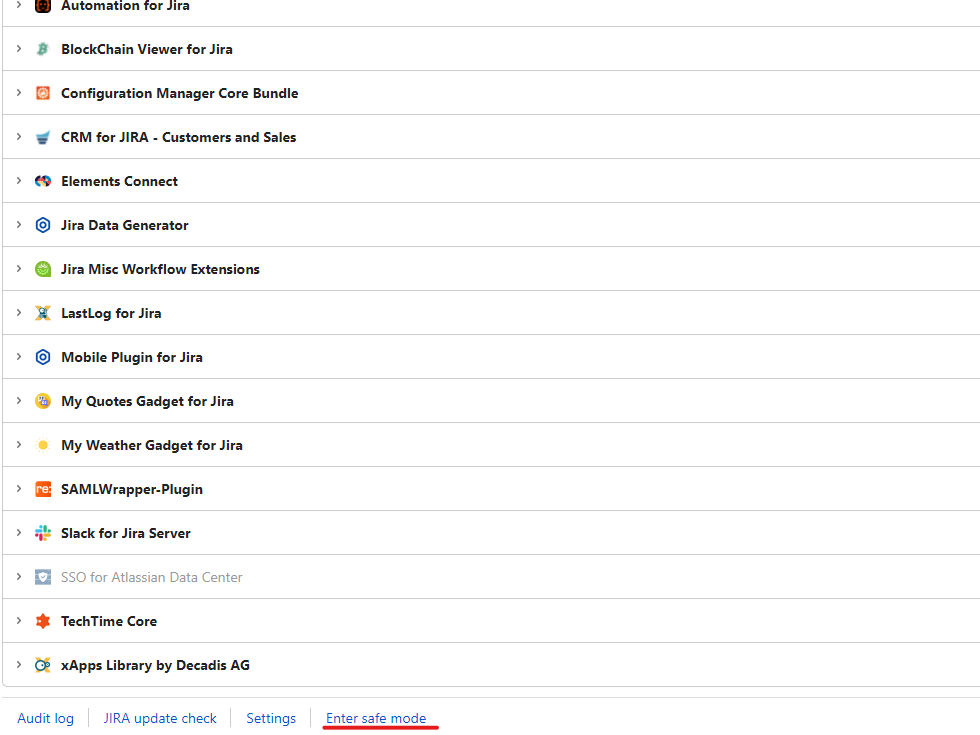
Now that we have a page selected, we need to get a baseline. This baseline is what we’ll compare the performance of each App to tell how it impacts the System. So, to start with the baseline, we need to disable all the Apps. This process can be done by going to your Manage apps page, scrolling to the bottom, and clicking the “Enter safe mode” link.
After it finishes processing, you should now see that all your Apps are disabled.

Now, go back to your test page, and run the benchmark three times. Running it multiple times will help you rule out random performance spikes, giving you a more accurate score overall. Be sure to record your score each Time. I will be using the actual Performance score for my testing, but as long as you are consistent with which stat you use, you are free to use whichever stat matters most to you. To rerun a test, just hit the clear button next to your report, then click “Generate report” again.
Now that we know how our System would behave without Apps, we can now go in turn and enable each App individually and rerun the test to see how that App alone impacts the System. Again, the goal is to see how each App impacts the System, so be sure that it is the only App running when you perform the test.
Be aware that some apps also require helper apps will automatically be activated – this is fine. These apps would always run in tandem anyways, so we are acceptable to measure them as a single entity. Just be sure to disable both the App and its helper before moving onto the next App.

After you finish all your testing, you should get something that looks like the above. This gives me an idea of how each App individually impacts Jira, as we ran the test with only one App enabled at a time.
But what does it mean?
So, we have data, but what does it actually mean?
Well, let’s start with the percent baseline score. This is a measure of how much better or worse than the baseline each App was. In general, this will be a negative, but you will get the odd test that shows positive. Does this mean that those Apps are so good that they make Jira MORE efficient? No – I don’t think so. I think these just got lucky on timing, and Jira wasn’t doing much when I ran those tests. I’m almost sure if I was to rerun them, they’d be different.
Does a bad score here mean the App is terrible? Again, I don’t think so. I’m running this against my own data set and instance configuration. So yeah, it might be bad for my System, but you don’t use my System. If you were to run the same set of Apps against your System, I would bet money you would get different results. The only thing I can really conclude is how Apps run relative to each other on my System.
Given that, no, I don’t see myself publishing this kind of testing on App reviews either. While it might be good to know how these Apps behave on my Jira instance, I don’t think it would be helpful to you to know how my testing fared. Unless I get something really egregious – like, say, if a single app brought down my performance by more than 90%. In that case, I’d consider it a PSA to warn you about that App. But I have yet to test any App that has done that poorly.
I think it is important to remember that under the hood, Jira is a very complex machine made of many parts interacting with each other. And with three tests per App, we are running an amazingly small sample size. Given that, we are bound to have outliers and even outright misleading data. So if you see something that doesn’t make sense, give it a few minutes and retest. The larger sample size might help you make sense of something you saw as a localized event rather than a trend.
If you are considering an App, this kind of analysis can definitely tell you what kind of impact to expect from it, which can save you a lot of headaches down the road.
Other Testing
If you really want to go the extra mile, you can start testing various combinations of Apps. My preferred way to do this is to group by the percent baseline. To do this, I would first enable all Apps that scored greater than -5%. Then enable all above -10%. Finally, continue down by fives until you have all Apps enabled.

How would I improve the testing?
I know this testing isn’t perfect. For one thing, I’d love to have a larger sample size per App. Unfortunately, time is a factor here. But, if you have an Intern you need to assign something to do, it might be worthwhile to have him collect information for you.
Another thing I’d suggest is you limit what other people are doing on the instance as much as possible. I’m fortunate that I don’t have anyone else using my test instance, so I can be reasonably assured no background shenanigans are going on. But it’s something I would be wary of if I was doing this on a corporate test instance.
And lastly, I’d advise you to not cherry-pick your results. It’s very tempting to call a result an “outlier” and throw it out when your favorite App returns a lousy result. But keep it in. It’s important to not let your own biases impact the results here.
What do you think?
Is this kind of testing something you could see as valuable? If so, I’d love to hear about it! You can comment on this story on Facebook, LinkedIn, Twitter, and Instagram. You can also subscribe to the blog to get new post delivered directly to your inbox! But until next time, my name is Rodney, asking, “Have you updated your Jira issues today?”

To be honest, I think the approach is nice, Ok for smal simple systems, not so good for larger instances.
For several reasons:
* The first part is that it is a huge load of manual labour to be facilitated, – for what is “a capture of a mesurement of a moment (state) in time”.
* Secondly, load, [virtual] hardware, environment (EC2, Azure, onPrem etc) are very dynamic themselves. Not many Jiras are placed on the physical servers with a minumin of not-shared network, firewall, loadbalancers in between the enduser.
* Third and most – when it comes to user-interaction and what those trigger of automations, listernes, events depending on extenal sources like DB/Rest lookup – this almost cant be replicated – and the interaction between add-ons are not counted.
Just counting, I have 121 groovy scripts – listerners, scripted fields, automations running (we dont allow inline scripts). And we have automations triggering automations/listeners – very dangerous by the way. On top ofm that lots of automations with no scripting.
We also have a lot of automatic issue creation as we use Jira Core for CRM and CMDB. So external events can trigger several issue creations “suddenly”.
Also I find the statement “So yeah, it might be bad for my System, but you don’t use my System. If you were to run the same set of Apps against your System, I would bet money you would get different results. The only thing I can really conclude is how Apps run relative to each other on my System. ” very real…. It for sure relateds to my third point and the “capture of a mesurement of a moment (state) in time”
And, Im NOT saying the article is pointless at all – its great for the obsevans of that Add-On has and can have serious performance impact, and Your conclusions in the sum up “How would I improve the testing?” are nice.
– my latest really bad experiend was just one week ago: https://community.atlassian.com/t5/Jira-Software-questions/Extreme-high-load-after-opgrading-to-8-17-1/qaq-p/1749452#M150148
Caused by either 1) A bad setting in Automation or 2) Bad handling on an allowed setting in Automation.
I see 2 approches that gives more benefit:
1) The typical “overall” experience like Google Analytics or Datadogs UX Monitoring/RUM – or similar. These will often pinpoint slow “Urls” over time – that we can investigate further and find some RCA.
2) APM stuff (jmx) like AppDynamics or DynaTrace. Very complicated – but has the ability to look into the engine og the JVM. Please do an article on using those 🙂
LikeLike
Your correct, this approach does not capture details that happen when using an automation ( or 121…which is impressive in and of itself). If anything, the approach I outline gives you a single snapshot.
The way I intend to use this in the future is to help me when I’m considering a new App. For example, I show testing each App individually, but you can also test the system before and after adding the trial App to get a good before and after. My goal was to get people thinking about App performance impacts, and give them one tool to evaluate Apps.
However, your topic suggestions are great ideas, I’ll add them to the backlog!
LikeLike
Does this approach also work for jira cloud? Don’t think so, but at least wanted to double check!
LikeLike
It should, but Apps work entirely differently on cloud, so we don’t have the same concerns that we do on Server and Data Center.
LikeLike
tip: You can check plugin’s impact on page load with this plugin: https://chrome.google.com/webstore/detail/atlassian-browser-devtool/ifdlelpkchpppgmhmidenfmlhdafbnke?hl=en it will show you WRM resources (and consequently: plugins) loaded on the page and what amount of them is unused.
In other words, you can check how much useless code a plugin loads. The slower your internet connection is, the slower PC you have, the colder cache your browser and server has => the slower your Jira is. We’re talking even couple of seconds to load issue view.
LikeLike