
Well, last week. Where do I begin? Maybe here:
Yeah, pretty good, right? I thought so too, then Thursday happened:
Just Wow. Thank you, guys! I keep finding that just when I see the ceiling for this community, you guys go and surprise me like this.
On top of the page views last week, I also had a number of you reach out to me last week for various reasons. However, one drew my attention in particular.

Well, Harsha, it’s been a while since I released a System focused post, so challenge accepted. Fair warning, though – this topic gets intense. Jira is a rather complicated system. Even if we ignore the configuration and focus on the system, there are still many places we need to check out to know what bottleneck is causing Jira to perform slowly. But too late, you’ve already asked for it, so let’s dive in.
Lag Sources
CPU
Well, this should have been obvious as the first place to look. If your CPU is overloaded, it’s going to impact performance for the end-user. It amazes me how many people skip looking at this and head directly to adding more Heap Memory to the JVM (which we’ll talk about in a moment). If you are on a Windows Server, you will likely know how to check CPU on it via the Task Manager’s Performance Tab.
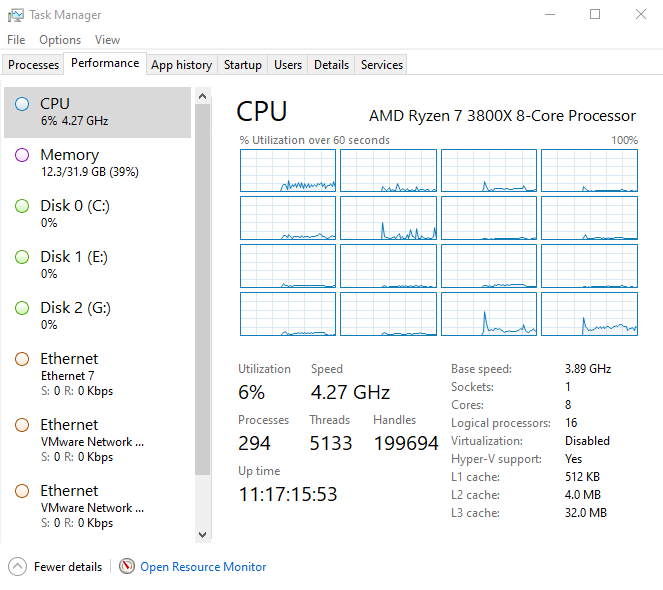
This utility will also give you information on Disk Throughput, Memory usage, and Network utilization – all good indicators if you are trying to diagnose slowness in your Jira instance. However, on Linux, I prefer to use the top utility.
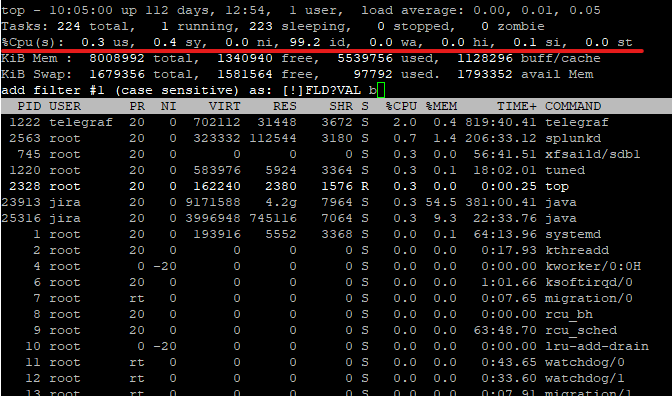
This tool will tell you many of the same things, but it requires some know-how to interpret. So why use top instead of something like glances or htop? Well, it’s because top is an almost universal tool on Linux systems. It is so rare that I encounter a system without it that I cannot actually remember it. So how do we interpret this data?
The first thing I usually look at is the load average. This measurement is broken down to load over the past 1 minute, 5 minutes, and 15 minutes. Ideally, this number should not get over 80% of the number of CPUs you have. Do you have 4 CPUs? That number shouldn’t be above 3.2, for example. It’s not an exact science, but it’s close enough to work as a rule of thumb.
Another place we can look at is the CPU Utilization, underlined above. These numbers are broken down into various categories, as shown below.
us: user cpu time (or) % CPU time spent in user space
sy: system cpu time (or) % CPU time spent in kernel space
ni: user nice cpu time (or) % CPU time spent on low priority processes
id: idle cpu time (or) % CPU time spent idle
wa: io wait cpu time (or) % CPU time spent in wait (on disk)
hi: hardware irq (or) % CPU time spent servicing/handling hardware interrupts
si: software irq (or) % CPU time spent servicing/handling software interrupts
st: steal time - - % CPU time in involuntary wait by virtual cpu while hypervisor is servicing another processor (or) % CPU time stolen from a virtual machine
The two we are most interested in is “us” – this will be the active Jira Processes, and “wa” – this will alert us to a slow disk problem. These measurements are broken down as a percentage of the total CPU capability of the system – so they all should add up to 100%. So if your us measurement is taking 80% or more of the total system usage, you are using too much CPU.
So, the answer is just adding CPUs, correct? The answer here is maybe. If you are on a VM, it might hurt more than help. How so? My understanding here is that the Hypervisor (that is the VM Server) will only schedule a given cycle for the VM if it has enough CPUs free for that cycle. Therefore, the more CPUs are allocated to the VM, the more the Hypervisor has to free up, and the more time between cycles on your VM. How much is the max for your Hypervisor? I cannot say, but your Hypervisor Admin should tell based on the VM Host’s CPU Utilization.
What if the wa value is high instead? This event is a sign that your disk speed may be limiting your system performance, at which point we’ll need to look at your disk speed – which we’ll discuss below.
Heap memory
So let me say – Atlassian already has an excellent video freely available on this. It’s called “Trash Talk! How to reduce Downtime by turning Garbage Collection,” and I still reference it to this day. Seriously give it a watch.
Oh – you’re still here. Well, this is awkward. I thought everyone would have gone off to watch the video. Seriously, I was at that talk at Summit 2016, and I still refer to this video as a refresher. If you are a Jira System Administrator, you owe it to yourself, your users, and your career to learn how to tune the JVM.
So what are the take-aways from the video? First, don’t try to change the GC Method or any of the GC Parameters. Atlassian sets these to settings that will work for 99.9% of cases. I usually only touch them if asked to by Atlassian support. No – what I typically tune is just these two numbers.

As a best practice, I like to set them equal, that way the JVM will reserve it’s max amount of memory on startup. This way I won’t be surprised in a day or two by an out-of-memory error (or worse yet, the system deciding to just kill the JVM process.)
The second takeaway is that it is entirely possible to cause performance problems by setting the Heap Memory too high. Doing so can cause one of two issues. In the first problem, you end up choking out legitimate system processes from Memory, slowing down the whole System by forcing it to use SWAP space. In the second, the JVM wait’s longer to do a Garbage Collection, which means that GC Cycle will is more likely to be a full GC where the System has to pause the JVM. If the JVM is paused, it is not serving Jira Pages…hence the lag.
So, how do we know what number to set it too? We have to run it for a while, then analyze the GC Logs to find that out. If we see that the JVM is doing Garbage Collections too frequently, we need to bump it up. If we see that the GC’s are pausing the JVM, we might look at bumping it down a bit. Unfortunately, there is no hard-and-fast rule that says, “If you have this many users, set it to this.”
Fileshare/Disk Speed
Now you know the CPU isn’t overloaded, and the JVM is tuned correctly, but your System is still slow. Where do you look next? Well, the file system. I alluded to this previously, but you can get a clue if your System is having some Disk Access issues by looking at the wa statistic in top. However, while that will help if it’s high, it can give a false negative.
The Good news here is that Atlassian gives us a guide on how to run a Disk Access Speed Test.
Basically, this will have you download a jar file from Atlassian Support, and run it against the location where Jira’s Index resides. Should look something like this:
 wget https://confluence.atlassian.com/jirakb/files/54362304/54591494/3/1444177154112/support-tools.jar
java -Djava.io.tmpdir=<Jira Home Directory>/caches/indexesV1 -jar support-tools.jar
If you run this, you should get a table like the one above. I typically look to the Median and Max columns, and compare against the table Atlassian provides (copied below).
| Statistic | Excellent | OK | Bad |
| Open | < 40,000 | 40,000 – 150,000 | > 150,000 |
| Read/Write | < 40,000 | 40,000 – 100,000 | > 100,000 |
| Close | < 20,000 | 20,000 – 100,000 | > 100,000 |
| Delete | < 50,000 | 50,000 – 300,000 | > 300,000 |
As we can see from my results, the medians are either in the OK or Excellent Range. However, my Max times are not (Also, OUCH on the Open Max). This result was likely an outlier caused by a problem on the VM Host, but cannot be ignored outright. If this were an enterprise setup, I’d start asking the VMware Admin questions to figure out if there are any problems with the storage and if we can speed it up at all.
My result is because I am running on seven-year-old hardware disposed of by some company as end-of-life and cobbled together by someone who is still learning.
Database
So, this will be a radical idea, but sometimes Jira’s slowness isn’t caused by Jira. Sometimes it’s caused by an external system. No, seriously, how well your Database performs will have a MASSIVE impact on how well Jira performs.
Atlassian thankfully also has a tool for this situation.
Again, this will have you download a jar and run it on your Jira server.
wget https://confluence.atlassian.com/jirakb/files/54362302/54591493/2/1444177155911/atlassian-log-analysis-0.1.1.jar
java -cp PATH_TO_THE/atlassian-log-analysis-0.1.1.jar:PATH_TO_YOUR_JDBC_DRIVER_JAR \
com.atlassian.util.benchmark.JIRASQLPerformance \
YOUR_DB_USERNAME YOUR_DB_PASSWORD \
JDBC_CONNECTION_STRING JDBC_DRIVER_CLASS \
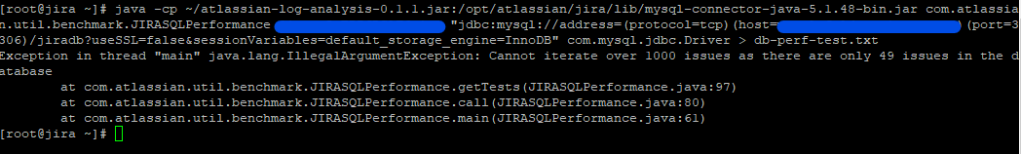
> db-perf-test.txtYou will get the YOUR_DB_USERNAME, YOUR_DB_PASSWORD, JDBC_CONNECTION_STRING, JDBC_DRIVER_CLASS settings from your Jira instance’s dbconfig.xml file. A note on this tool: you need 1000 issues in your Jira instance to run it, as I found out the hard way.
However, Atlassian does give you an example of what the output should look like.
TOTALS
----    ----    ----    ----    ----
stat    mean    median  min max
----    ----    ----    ----    ----
retrieve-issue  5,338,000   979,000 213,000 46,007,000
get-issue   174,775 93,000  62,000  11,621,000
retrieve-workflow   5,117,153   607,000 341,000 47,738,000
get-workflow    98,996  64,000  40,000  2,962,000
retrieve-custom-field-value 601,093 495,000 316,000 23,082,000
get-custom-field-value  91,246  52,000  37,000  3,453,000
----    ----    ----    ----    ----
All times are in nanoseconds.
Atlassian states they don’t have an “Excellent, Good, Bad” chart for DB Values clearly defined, but they tend to look for any values below 20ms as good, and 10 ms as Ideal. (Remember, 1ms = 1,000,000 nanoseconds).
Network
Well, it’s not the CPU, it’s not the Memory, File System, or Database. What does that leave? Well, the network can be a bottleneck. You can usually check this with a simple ping test. Does the ping take a long time to reach the Server? Then you are more likely to see issues with Jira’s speed.
Look, I get it. You might be in India, and your company’s Server is located in the United States. You are only ever going to get your pings so low. If you are on Data Center, you can use a CDN to help with some of that latency, but it will take actual time for the packets to travel around the world.
However, if you are located in the same building as your Jira Server and are still getting high pings, it might be time to talk with your Network Admins to figure out what is going on – especially if you’ve run all the test to say it’s not the Jira Server itself.
Maybe it’s just busy.
Look, I’ve done my best to ignore the Jira Configuration in all this and focus solely on the System. However, you will get to a point where it will become impractical to add more Memory or CPUs to a server. At that point, you have two real options.
For your first option, You can do the hard work and clean up your configuration. Get rid of unused workflows and permissions schemes, consolidate duplicate custom fields, and get Jira healthy in that regard. It’s not easy, and may not be politically expedient, but it is well worth it.
Your other option is to migrate to a Data Center Architecture. Look – there are only so many users a single server can handle. Data Center Edition solves this by spreading the load out to several servers, each working together to form a single Jira instance. I have several articles already on how to convert your Jira server instance into a Data Center instance. So if this sounds like you, maybe it’s time to consider an upgrade.
Well, there you go!
Look, this is an involved topic. Pinpointing your performance issue to a single cause is tough – especially when it’s a real possibility that there are several causes. But it’s well worth it to go through each of these and see how your System is doing.
This week has been a busy one. I haven’t had a chance to read as much or do research like I usually like to do. So, I only have one webinar to share with everyone this week. “Get Jira superpowers: Reporting on Projects and Calculated Fields” is a joint presentation by Deiser, Old Street Solutions, and cPrime. And it’s tomorrow, 11:00 AM Eastern time! You should check it out!
As always, if you enjoyed this post you can subscribe below to receive new blog posts directly to your inbox. You can also like, follow, and comment on social media to help your colleagues discover our content! You can find me on Twitter, Facebook, and LinkedIn with regular updates, new posts, and news about the blog. But until next time, my name is Rodney asking, “Have you updated your Jira issues today?”
