
Hey everyone! Hope everyone is staying safe and healthy this week. I normally work from home, so it’s been mostly business as normal for me. The only change is now my wife is also working from home. However, Animal Crossing has been doing a lot to help us keep busy. In speaking of which, I did catch this:

So this week we have another App Review. You guys seemed to like the last App Review I did, so I figured I’d look at another. Fortunately, the time is right for looking at new Apps. Traditionally Summit is where various Atlassian Partners would be putting out their Apps for review and testing. I was fortunate enough to connect with Evan Golden with SmartDraw, who gave me the grand tour.
Now, I always feel it’s important you know where my motivations are. As such, this is not a paid sponsorship. This is a review done on my own volition, because I feel it does solve a problem.
The Problem
It is my believe that every App you add into JIRA should solve some problem that JIRA Alone cannot solve. Otherwise, why are you wasting the money, time, and resources to run it? So, lets imagine this:
You are in a meeting with a VP who wants to bring some process into JIRA “to improve visibility”. He has no interest in learning to query JIRA or setup a dashboard himself, so he’s unfamiliar with what you can put onto a dashboard. However, he wants a bunch of metrics that JIRA simply don’t have gadgets to do on a dashboard in vanilla JIRA.
You can go out and purchase a bunch of add-ons to do what he wants, but at one add-on per gadget, that can add up quickly – in terms of cost and resources. Not an ideal solution. If only there was one App that could give you any gadget you want with minimal effort…
The Solution
As I hinted to, I don’t like it when an App only adds one dashboard gadget. You can get a tool that does only one thing, and sometimes that is unavoidable, but wherever possible you should get a tool that can be used in a multitude of situations.
That gets us to VisualScript for JIRA. What this App does is allow you to setup custom gadgets (called Reports) powered by JavaScript. This allows you to offload the processing to generate the tables, charts, and figures to your user’s browser, meaning you can get some fancy affects without too much of a hit on performance.

All that’s great and all, but you (like me), probably don’t know java script, nor do you have the time and energy to learn it from scratch. Correct?
That’s where I think this App really shines. It comes with a number of built in reports that you can import and use out of the box, or even modify to suite your needs. These reports span both ITSM and SAFe Agile practices.
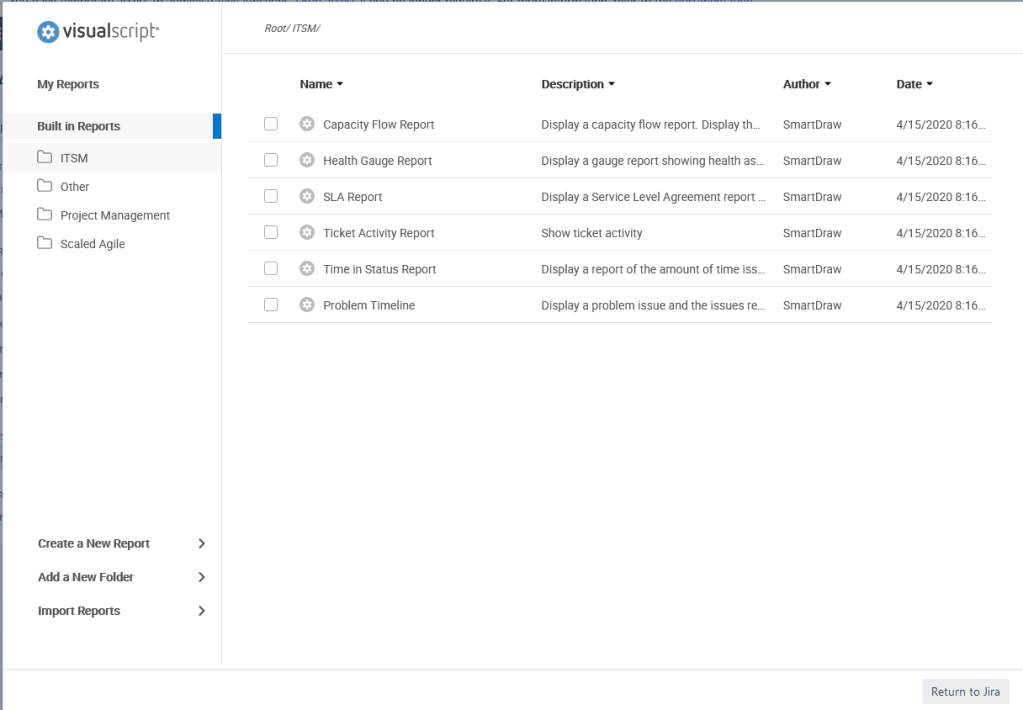
ITSM
Most of these appear to not be in the release I have for VisualScript, but they were so compelling for ITSM that I felt I should share them. The version Evan demonstrated for me was a per-release version, and he kindly send me some of the slides to include in the review for me to show to you.
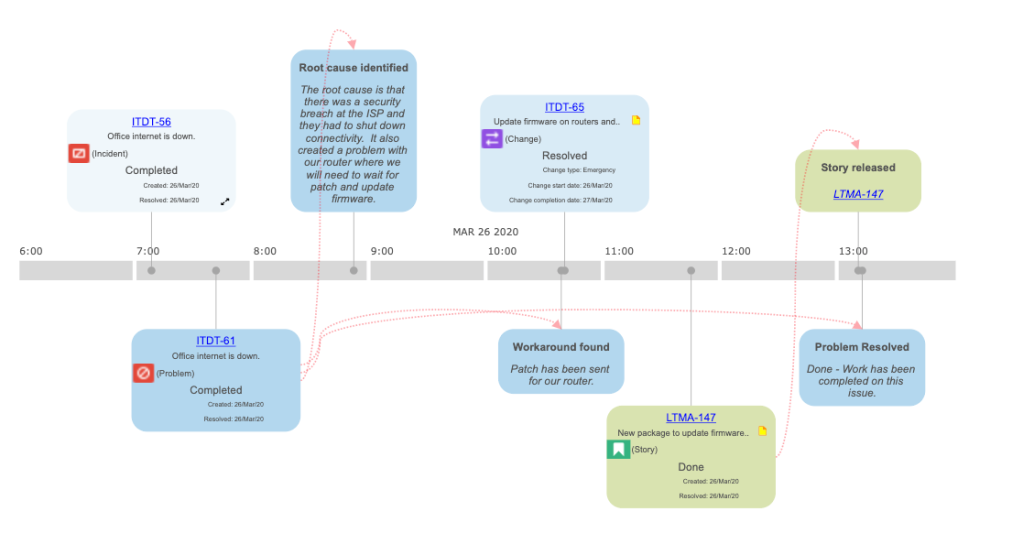
This first report is something I REALLY like. It is simply a report showing the timeline of a problem – from initial incident to Dev story resolution. This is similar to what Atlassian is rolling out for JIRA Service Desk and Opsgenie in the cloud, but you can get this in your JIRA Server/DC instance today!
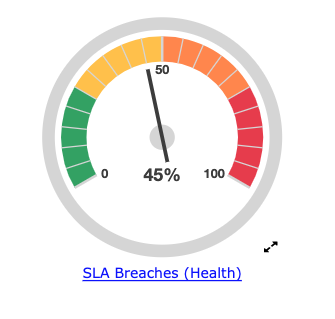
Another ITSM gadget I really like is these SLA Gauges. I love the visual appearance of a gauge, and feel it can tell you a good bit of information intuitively. Unfortunately, there is no such gadget within JIRA out of the box, and I’ve never been comfortable with one-shot Apps that add them, so seeing this in the demo was pure 😍.

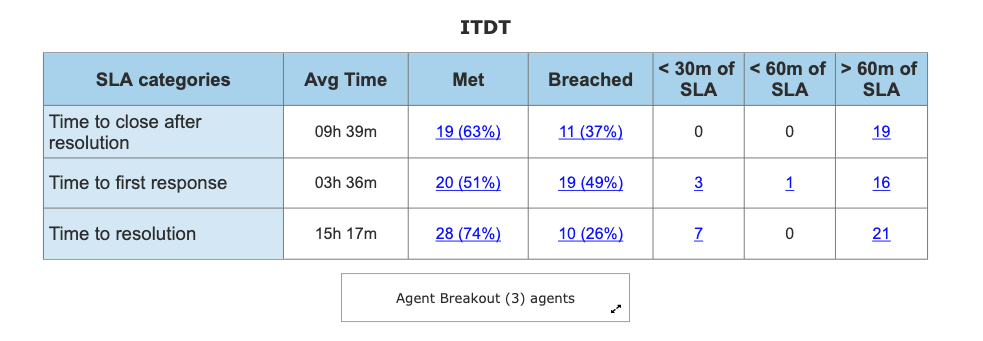
In speaking of SLA’s, getting aggregations of that data can be troublesome. Yeah, you can see which ones have breached, but how is your team doing as a whole. There was a report for that too:
SAFe
As I’ve tried to be clear with everyone, I don’t know everything. While I am traditional agile trained, I’ve never taken it the step further to learning SAFe. I know the general idea, but not the details. That being said, I know what JIRA can do and can’t do, and know some of these next few reports are sorely lacking in JIRA. Disclaimer out of the way, lets dig in.
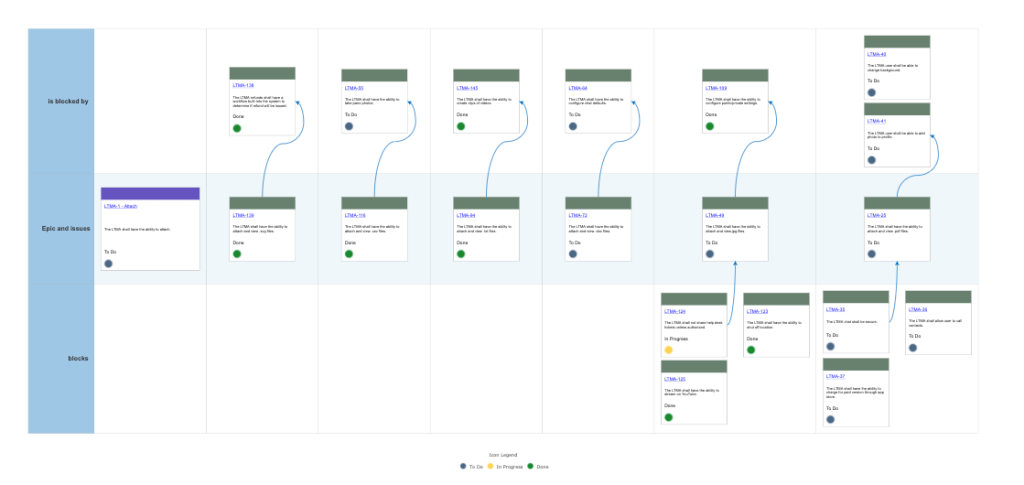
The first report I thought was interesting was the PI Planning Board.

This gives you a great way of seeing how the stories (and more importantly the dependencies) map across multiple teams across your entire PI. I know this type of view is not really possible in vanilla JIRA, so I can see how if you are practicing SAFe methodology, this can absolutely be needed.
Another great view into your SAFe methodology was the Program Velocity Report. I thought this was a great way to view the entire organization’s velocity to make sure you are meeting your goals.

And yet another view on how your doing is the Epic Dependency Report. This one rather than looking at an org or a group, looks at an individual Epic, and how each of the issues under it are interdependent. This is great for trying to find the critical path of that epic.
And more!
As I said, the built-in scripts are crazy powerful, and WELL worth the price of admission. But I still feel the ability to create your own reports for dashboards is what takes it to the next level. Especially if you have someone who knows JavaScript on staff already.
But even if you don’t, It looks like there is a community where people can share Reports and scripts they have created. This is something I’m most definitely going to keep an eye on in the future, as I’d like to see what people create using this tool.
So, what do you think?
I’m always on the lookout for interesting Add-ons and Apps to share with you. What are some of your favorite Apps for JIRA or Confluence? Let me know some of your favorites here, on LinkedIn, or on Twitter, and if I see something I find interesting, I might cover it!
I’m also always willing to take on reader requested topics, so if you have something you want me to cover, let me know and I’ll look into it!
As I stated last week, I’ve created a twitter account for the blog! If that’s your social media of choice, give us a follow at https://twitter.com/theJIRAguy
But until next time, my name is Rodney, asking “Have you updated your JIRA Issue today?”

Thank you for this great review!
I’m a beginner as a Jira-administrator, so this really helped me to understand Visualscript. I have also looked into easyBI for Jira, what do you think about that add-on?
Best regards,
Felicia
LikeLike