

Well, that’s a thing. For those that don’t know, Rachel pretty much wrote the book on being a JIRA Admin. So, I guess it’s time to put up or shut up. JIRA Logging, lets do this.
For those of us in the trenches, logs are life savers. No, really. When something goes wrong within an application, logs often are our first, and sometimes only view into why it went wrong. You can tell a lot about what JIRA is doing from it’s logs – If you know what to look for.
As always, we start any look into a new aspect of JIRA by looking at the documentation. Here, we find the relevant document under Logging and Profiling:
Where to find your logs.
Finding your logs is actually pretty simple, assuming you know where your home directory is. Your log files for JIRA can be found at <jira_home_directory>/log/.
Navigating here, you will see several log files, usually along the lines of “atlassian-jira-<name>.log. If that log has had a roll-over, you will see some repeats of them, with older ones being followed by a number.

The one we will be interested in nine times out of ten is the atlassian-jira.log file.
But what about the Catalina.out file?
You my have noticed another log file in the JIRA install directory called catalina.out. This is tomcat’s log file, and while it replicates most of what is in atlassian-jira.log, it won’t have everything JIRA’s doing in there. Furthermore, it will muddy the water with additional information from Tomcat. If you haven’t changed any settings in the JIRA install directory, you won’t have a lot of reasons to go into there.
However, I have found catalina.out helpful when I’ve had an issue starting JIRA because the JVM environment was misconfigured. In that case, JIRA’s logs will have nothing, but Tomcat will report the Java error. If your JIRA is up and running though, don’t worry about this log.
Typical Logs
So, here is a snapshot of the logs after doing some typical things within JIRA:
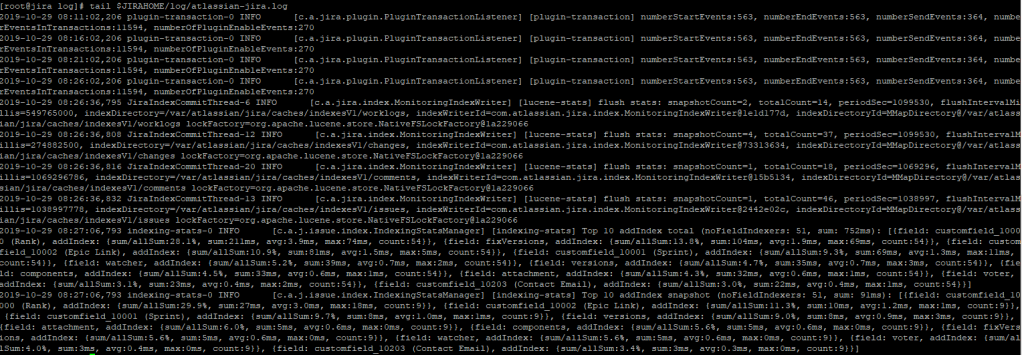
Yeah, you may have to zoom in a bit there. But for the whole, looks like organized chaos. And well, it is. And in a live production environment, these may be zooming by so fast you may not have a chance to actually absorb what’s happening. With a bit of practice you can get to a point where you can watch the logs stream by and see only the things that look out of the ordinary…but even that’s not perfect. However, lets look at one entry, when I access the login page for JIRA.
2019-10-29 08:08:44,423 http-nio-8080-exec-23 INFO anonymous 488x35978x1 xmd6sf 192.168.<redacted>,192.168.<redacted> /rest/gadget/1.0/login [c.a.jira.index.MonitoringIndexWriter] [lucene-stats] flush stats: snapshotCount=6, totalCount=63, periodSec=486768, flushIntervalMillis=81128149, indexDirectory=null, indexWriterId=com.atlassian.jira.index.MonitoringIndexWriter@19cc4430, indexDirectoryId=RAMDirectory@5d7db2f9 lockFactory=org.apache.lucene.store.SingleInstanceLockFactory@14d78abf
So, what do we have going on here. At first glance, we notice several parts.
Time Stamp and Misc Information
First, we have the time stamp. This is often the best thing to filter off of. If you know when an event you are interested in happened, you can start around that time and work your way backwards. It can narrow hundreds of thousands of lines to maybe a few hundred.
The next bit is just an identifier that tells you what part of JIRA is generating the log. for the above entry, it’s the web server. It may take some digging to figure out what is a part of what and honestly unless you are doing log aggregation, it likely isn’t going to help you a whole lot.
Logging Level
The third bit – that’s interesting. It’s the logging level. Logging levels tell the application how much of what’s going on you want recorded, and come in five levels:

You may notice I put them onto a scale. That is because as you change the logging level, you are increasing or decreasing how much of what is going on is recorded to the logs. I could do a whole post on logging levels alone, but the gist of it is if you set debug, you can almost watch all the variables change in real time in the logs. If you set it to Fatal, JIRA will only log entries when something catastrophic happens, and even then will likely leave out details leading up to the crash.
So this leads to the question: “If not enough information is a bad thing, why don’t we set everything to Debug and log all the things?”

If you haven’t guessed, there is a trade-off. Here, it’s disk space. If you set everything to Debug before you leave on Friday, by the time you are sitting down for dinner on Saturday, you’re going to be paged for a full disk. No really, you’ll be surprised how fast text can fill up a hard drive.
Speaking in general, you can also use Logging levels to tell if something bad is happening. The Developers will assign different events to different logging levels, based on their best guess on how important it is to log. That being said, I’ve seen items that were Warn or Error that were no big deal, and I’ve seen Info level log entries that were actually concerns. The easiest example I can think of is actually in my logs right now:
2019-10-29 08:30:11,656 Caesium-1-1 INFO ServiceRunner     [c.a.crowd.directory.DbCachingRemoteDirectory] Incremental synchronisation for directory [ 10000 ] was not completed, falling back to a full synchronisation
2019-10-29 08:30:11,656 Caesium-1-1 INFO ServiceRunner     [c.a.crowd.directory.DbCachingRemoteDirectory] INCREMENTAL synchronisation for directory [ 10000 ] was not successful, attempting FULL
This is a log level INFO, but it’s saying something causing it to fail an incremental synchronization from my LDAP Directory. In my test environment, the LDAP directory is small enough this won’t be a problem, but in a full corporate LDAP directory, this can cause a significant overhead. I’ve even DDoS’ed my own JIRA instance trying to do a full directory sync. And again, this is only a “INFO” level log…
Identifier
After the Log Level, we have the identifier information. For web traffic and actions, this will tell you whose account initiated the action that resulted in the log. If you have a problem that only one user is reporting, this can help as you can search the log for that username. Of if you want to know if that person did something that caused problems, there you go too.
For web traffic, this is also accompanied by a couple of IP Addresses, usually the user’s clientside IP Address, followed by the IP address of your proxy. This can be helpful for identifying traffic originating from outside your network, or investigating access that didn’t look right.
Package
After you have your identifier, you will see a section in a bracket. This is the package that generated the log. In lay mans terms, this is a more specific part of JIRA that generated the log. This can be a specific plugin (or part of a plugin), or a particular routine within JIRA. You can see the list of packages and their associated logging levels within the System -> Logging and Profiling section of the Administrative Control Panel in JIRA.
In speaking of Logging and Profiling, you can also change the logging level per package in this section as well. These changes will persist until the next time you restart JIRA. In a future post we’ll also cover how to change them permanently. You also have access to an even deeper logging level here called “Trace” – but it is recommend you only use that if you are asked to by Atlassian Support in order to help with a specific issue. Your disks will thank you.
Message
After all these details, we get to the meat of the log – the message. This is what happened, or didn’t happen, that warrants logging. This is the “What” to the rest of the logs “Who, When, and Where”. This is where you can dig in to find whatever problem you are looking for.
And that’s what’s in your JIRA Log
And that’s pretty much it. I do have one more thing for you. For me, reading white logs on a black background can make things easy to get mixed up. To help with this, I wrote up a quick little script that will look up where you JIRA Log is, and pass it through an Awk filter so that it will colorize things based off the log level for each entry. It will also follow the log, which means it will display entries in real time as they are updated into the logs, and keep doing so until you hit “Ctrl+C”.
For reference, the colors each log level will be:
- DEBUG: Green
- INFO: Default
- WARN: Yellow
- ERROR: Red
- FATAL: Magenta
#!/bin/bash
# Rodney Nissen
# Version 3
# Updated 10/29/2019
# Update JIRAINST to point to your JIRA Install Directory

JIRAINST="/opt/atlassian/jira"
JIRAHOME="$(sudo cat $JIRAINST/atlassian-jira/WEB-INF/classes/jira-application.properties | grep "jira.home = " | cut -d ' ' -f 3 | tr -d '\r')"
JIRALOG="$JIRAHOME/log/atlassian-jira.log"

sudo tail -f -n 50 $JIRALOG | awk '
  /DEBUG/ {print "\033[32m" $0 "\033[39m";next}
  /WARN/ {print "\033[033m" $0 "\033[39m";next}
  /ERROR/ {print "\033[31m" $0 "\033[39m";next}
  /FATAL/ {print "\033[35m" $0 "\033[39m";next}
  1
'
I hope you will get as much use out of this tool as I have. As I stated in several parts of this post, I think this is the kind of subject that deserves a series of posts, not just one. As such, I’m thinking I’m going to do at least two more – one is an in depth dive into Logging Levels and what they actually mean, and another on how to play around with your logs. But until then, I’m Rodney, asking “Have you updated your JIRA Issues today?”

Hi Rodney,
Thank you for this wonderful document on how to read the logs. Could you please let me know where should the bash script be inserted for the easy reading?
LikeLike
The script can be placed anywhere on your Linux system. Just be sure to update the JIRAINST variable to wherever you have installed JIRA, and be sure your account has rights to access both the JIRA Install directory and the JIRA Home Directory.
LikeLike