
Note from the future: I’ve actually written a much better article on this you can find here: Monitoring JIRA for Health and Fun. You will find much better information there. I’m leaving this up as a testament to the past, but figured I’d save you the work.
So, confession time. I am a sucker for data. I love seeing real time graphs of system stats, performance, events, etc.

So when I saw the following blog post being shared on reddit, it was a no brainer.
Jira active monitoring 24/7 with Prometheus + Grafana
It was a great read and a great guide. I chose to set up Prometheus in a docker container as all my other monitoring tools are there, but aside from that his guide was spot on, and I encourage everyone to read it.
However….
It didn’t quiet go far enough, in my mind. I could get a ton of stats that I couldn’t get before: licensed user count, logged in user count, attachments storage size. But without being able to tie it to what the underlying system was doing it just felt…incomplete. I mean it’s great you can tell you have 250 users logged in, but is that what’s really causing the lag in the system?
Luckily I had another tool in my toolbelt. I had previously setup Grafana and InfluxDB/Telegraf for use on other systems. It was merely a matter of setting up telegraf on the JIRA server, and start pumping in the required data that way.
To see how to install InfluxDB and Grafana via docker, I’d first suggest following this guide from a fellow homelabber:
My JIRA system runs on CentOS, so my first step in getting JIRA’s server info was to get the InfluxDB added to yum. To do so, I executed the following command:
cat <<EOF | sudo tee /etc/yum.repos.d/influxdb.repo
[influxdb]
name = InfluxDB Repository - RHEL
baseurl = https://repos.influxdata.com/rhel/7/x86_64/stable/
enabled = 1
gpgcheck = 1
gpgkey = https://repos.influxdata.com/influxdb.key
EOF
After this, it was a simple thing to do a yum install, and boom, I had telegraf on the system. As a matter of disclosure, I did look that up here, it’s not like I just knew it.
After installing it, I did need to configure it so that it would gather and send the stats I was interested in to InfluxDB. To do so, I took a backup of the default config file (found at /etc/telegraf/telegraf.conf), then replaced the original with my own generic config file for Linux systems:
[global_tags]
[agent]
  interval = "10s"
  round_interval = true
  metric_batch_size = 1000
  metric_buffer_limit = 10000
  collection_jitter = "0s"
  flush_interval = "10s"
  flush_jitter = "0s"
  precision = ""
  debug = false
  quiet = false
  logfile = "/var/log/telegraf/telegraf.log"
  hostname = "<<system host name, optional>>"
  omit_hostname = false
[[outputs.influxdb]]
  urls = ["<<url to your influxdb server>>"]
  username = "<<influxdb user>>"
  password = "<<influxdb password>>"
[[inputs.cpu]]
  percpu = true
  totalcpu = true
  collect_cpu_time = false
  report_active = false
[[inputs.disk]]
  ignore_fs = ["tmpfs", "devtmpfs", "devfs", "overlay", "aufs", "squashfs"]
[[inputs.diskio]]
[[inputs.kernel]]
[[inputs.mem]]
[[inputs.processes]]
[[inputs.swap]]
[[inputs.system]]
Then it was a matter of starting Telegraf, confirm in the logs that it was sending, and then start work in Grafana. After working the data a bit, I got the following dashboard:

Now, this is still very much a work in progress. For one thing, the orange line is supposed to be the max java heap, and unless I stop JIRA and change it – I don’t think it’s supposed to change. And those gaps aren’t me restarting JIRA, so it should have been constant. (proxy problems, ammirite?)
The particularly tricky one to do is the CPU Graph and guage. Telegraf will breakdown CPU usage into io_wait, user, system, etc. To be fair, this is how it’s recorded to Linux internally, but to get a unified number, I had to take the idle time on the CPU, multiply it by -1, then subtract it from 100.
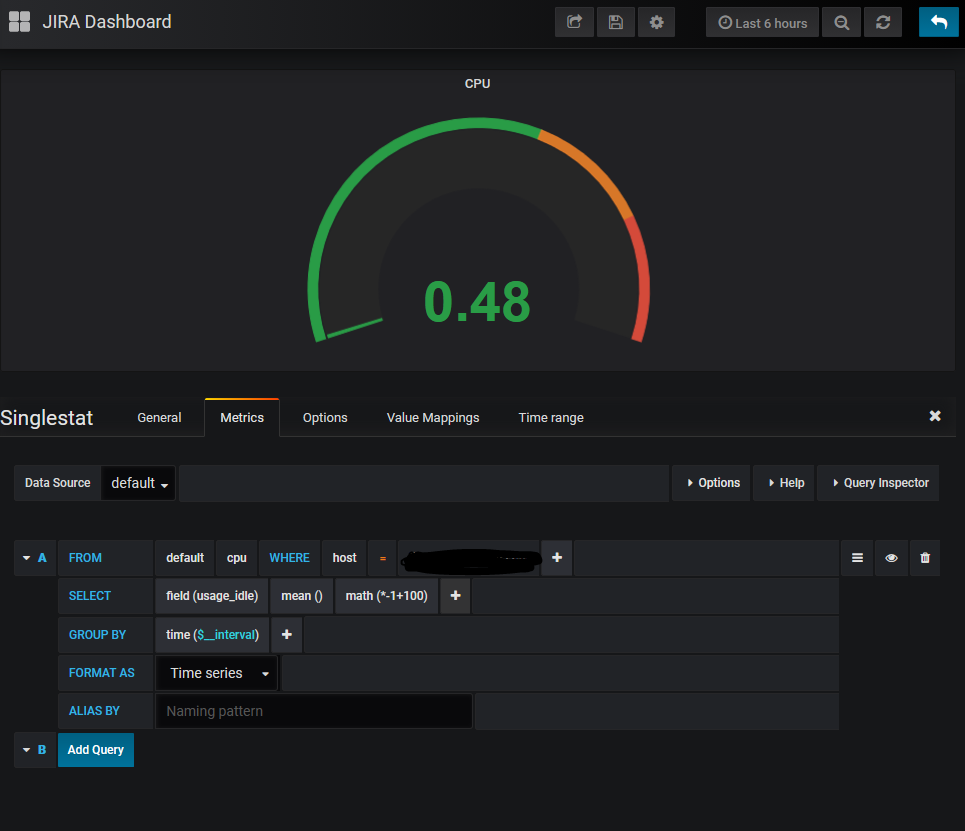
The second gotcha is under to options tab of the single stat block. It will always default to give you an average – which at times you will want. But in most cases will give you weird readings, like 0.4 users are currently logged in instead of one. To fix this, simply change it to read “Current”, as shown below.

So, you may be asking yourselves, why?
My first answer would be “Have you seen it! It’s just cool a.f.!”
But my second, more practical answer is incident detection and response. Just like in JIRA, Dashboards here give you and idea of whats going on now, as well as what’s been going on previously. You can even expand on this to tell if you are using swap, which could severely slow down a system. Or if you are out of memory for the JVM setting you have. Or you don’t have enough CPU power to process all the requests. And you can tell all this at a glance. You can even have this posted on a monitor on the wall so everyone can see it in real time.

So this post is a bit short…
I just got back home yesterday from a last minute trip I had to take. I knew I’d want to update the blog, but honestly couldn’t think of what to do it on. Luckily while I was gone I had worked on this as a distraction, so here we are. But this is a tool I wish I had one some of my previous engagements, and figured some of you might be able to use it as well. So, until next week, when I can hopefully complete part one of the Installing JIRA from scratch, this is Rodney, asking “Have you updated your JIRA issues today?”

1 Comment